
- Home >
- Stock Photos >
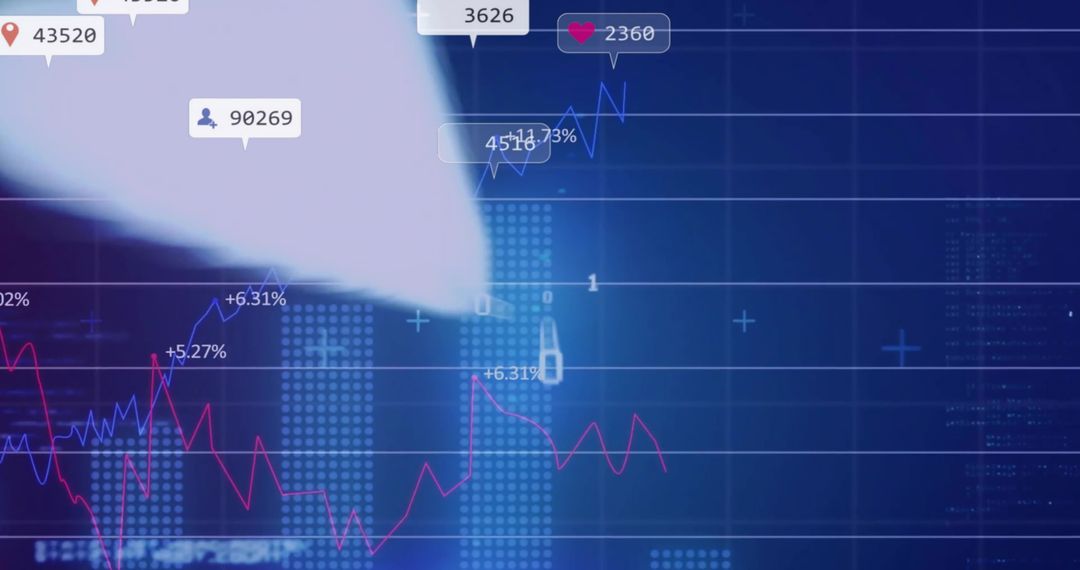
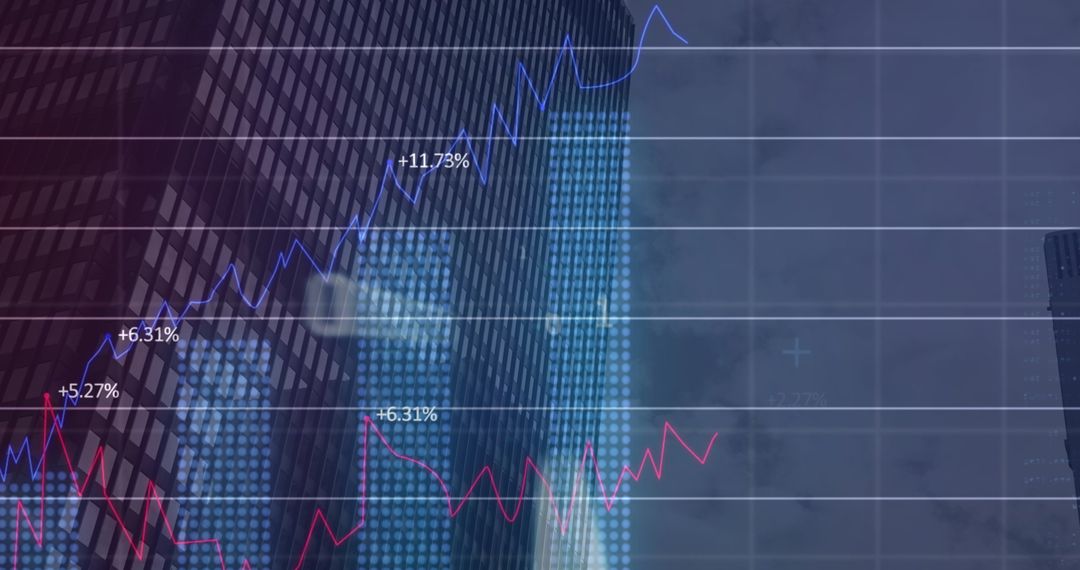
- Cyan Node Highlighting Data Point on Digital Finance Dashboard with Trend Lines
Cyan Node Highlighting Data Point on Digital Finance Dashboard with Trend Lines Image

Showing cyan node and pointer blur on digital dashboard, highlighting data point and trend movement. Featuring layered line graphs, percentage labels, and dotted bar grid for modern finance analytics look. Working well for fintech landing pages, financial reports, investor presentations, blog posts about market trends, and UI design mockups. Providing ample negative space on right side for headline and call to action overlay. Suited for hero banners, social media posts, newsletter headers, corporate slide decks. Editable color scheme and crop suggestions: crop tight for emphasis on node or wide for full grid context. Use overlay text in white or light cyan for maximum readability against deep blue background.
Powered by  - Get 15% off with code: PIKWIZARD15


0
downloads
downloads
Tags:
More
Credit Photo
If you would like to credit the Photo, here are some ways you can do so
Text Link
photo Link
<span class="text-link">
<span>
<a target="_blank" href=https://pikwizard.com/photo/cyan-node-highlighting-data-point-on-digital-finance-dashboard-with-trend-lines/82dcb646e6422229c350e7e536b5b729/>PikWizard</a>
</span>
</span>
<span class="image-link">
<span
style="margin: 0 0 20px 0; display: inline-block; vertical-align: middle; width: 100%;"
>
<a
target="_blank"
href="https://pikwizard.com/photo/cyan-node-highlighting-data-point-on-digital-finance-dashboard-with-trend-lines/82dcb646e6422229c350e7e536b5b729/"
style="text-decoration: none; font-size: 10px; margin: 0;"
>
<img src="https://pikwizard.com/pw/medium/82dcb646e6422229c350e7e536b5b729.jpg" style="margin: 0; width: 100%;" alt="" />
<p style="font-size: 12px; margin: 0;">PikWizard</p>
</a>
</span>
</span>
Free (free of charge)
Free for personal and commercial use.
Author: People Creations
Similar Free Stock Images

Premium


Premium


Premium


Premium


Premium


Premium


Premium


Premium


Premium


Premium


Premium


Premium


Premium


Premium


Premium


Premium


Premium


Premium


Premium


Premium


Premium


Premium


Premium


Premium

