
- Home >
- Stock Photos >
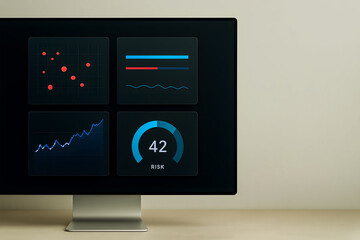
- Cyber Analytics Dashboard Showing Multicolor Waveforms on Neon Cyan Grid Interface
Cyber Analytics Dashboard Showing Multicolor Waveforms on Neon Cyan Grid Interface Image

Displaying neon cyan grid with central console panel, plotting layered multicolor waveforms and flagging redacted fields, creating high-tech cyber analytics mood. Serving website hero banners, cybersecurity report covers, tech blog headers, SaaS product pages, investor pitch decks, presentation slides, and social media ads. Supporting UI mockups, dashboard templates, data science articles, and training materials, providing dramatic visual focus for concepts like network monitoring, threat detection, real-time analytics, and data visualization. Offering color palette and line motion, creating strong neon aesthetic for futurism-focused campaigns and brand storytelling.
Powered by 


downloads
Tags:
More
Credit Photo
If you would like to credit the Photo, here are some ways you can do so
Text Link
photo Link
<span class="text-link">
<span>
<a target="_blank" href=https://pikwizard.com/photo/cyber-analytics-dashboard-showing-multicolor-waveforms-on-neon-cyan-grid-interface/c7a4b678e5da78da703838a644a339b7/>PikWizard</a>
</span>
</span>
<span class="image-link">
<span
style="margin: 0 0 20px 0; display: inline-block; vertical-align: middle; width: 100%;"
>
<a
target="_blank"
href="https://pikwizard.com/photo/cyber-analytics-dashboard-showing-multicolor-waveforms-on-neon-cyan-grid-interface/c7a4b678e5da78da703838a644a339b7/"
style="text-decoration: none; font-size: 10px; margin: 0;"
>
<img src="https://pikwizard.com/pw/medium/c7a4b678e5da78da703838a644a339b7.jpg" style="margin: 0; width: 100%;" alt="" />
<p style="font-size: 12px; margin: 0;">PikWizard</p>
</a>
</span>
</span>
Free (free of charge)
Free for personal and commercial use.
Author: People Creations
Similar Free Stock Images

Premium


Premium


Premium


Premium

Premium


Premium


Premium

Premium


Premium


Premium

Premium


Premium


Premium


Premium


Premium

Premium


Premium


Premium


Premium


Premium


Premium


Premium
Premium


Premium

Premium


Explore More Free Stock Images