- Home >
- Stock Photos >
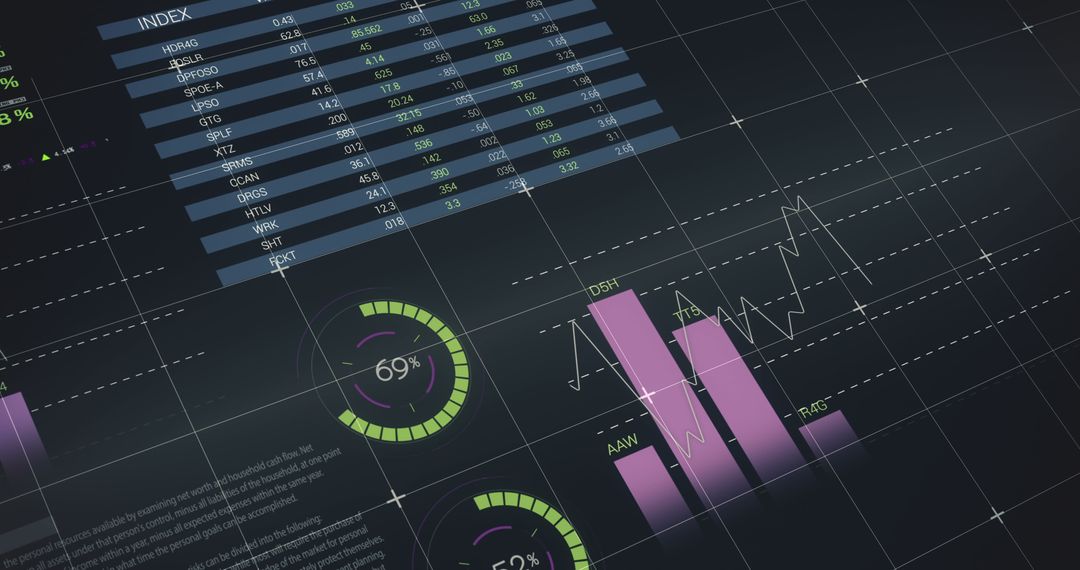
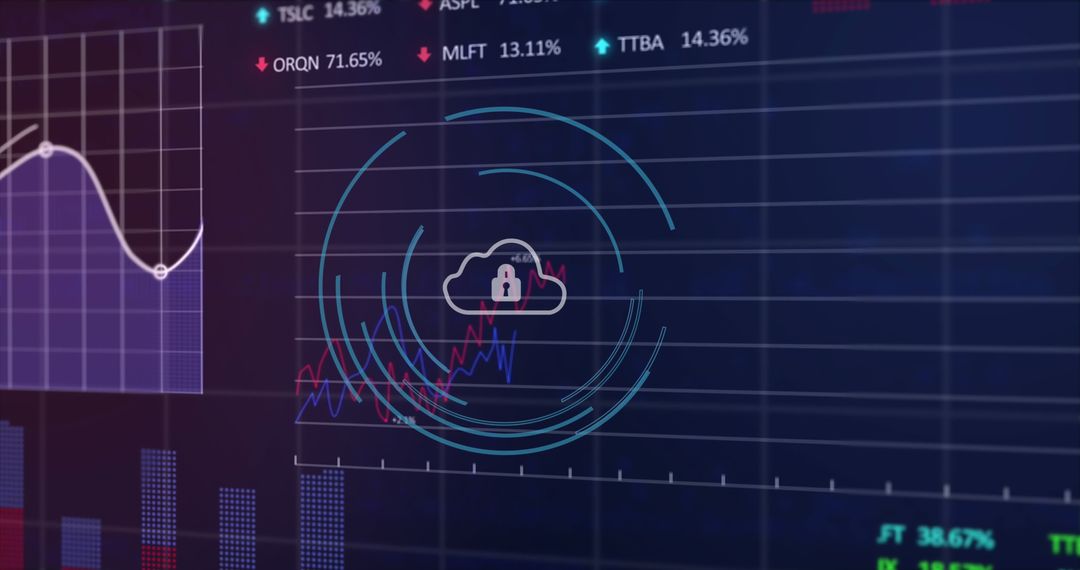
- Cybersecurity and Data Analysis Concept Over Financial Graphs
Cybersecurity and Data Analysis Concept Over Financial Graphs Image

Depicts cybersecurity concepts with a shield icon overlaying financial charts, symbolizing protection and secure data analysis in financial markets. Suitable for illustrating themes related to network security, financial tech, data analytics, and information safety. Ideal for publications, blogs, or presentations about cybersecurity in finance.
Powered by 


2
downloads
downloads
Tags:
More
Credit Photo
If you would like to credit the Photo, here are some ways you can do so
Text Link
photo Link
<span class="text-link">
<span>
<a target="_blank" href=https://pikwizard.com/photo/cybersecurity-and-data-analysis-concept-over-financial-graphs/9478e276f26ba3010720509261cd9c52/>PikWizard</a>
</span>
</span>
<span class="image-link">
<span
style="margin: 0 0 20px 0; display: inline-block; vertical-align: middle; width: 100%;"
>
<a
target="_blank"
href="https://pikwizard.com/photo/cybersecurity-and-data-analysis-concept-over-financial-graphs/9478e276f26ba3010720509261cd9c52/"
style="text-decoration: none; font-size: 10px; margin: 0;"
>
<img src="https://pikwizard.com/pw/medium/9478e276f26ba3010720509261cd9c52.jpg" style="margin: 0; width: 100%;" alt="" />
<p style="font-size: 12px; margin: 0;">PikWizard</p>
</a>
</span>
</span>
Free (free of charge)
Free for personal and commercial use.
Author: Authentic Images
Similar Free Stock Images

Premium


Premium


Premium


Premium


Premium


Premium


Premium


Premium


Premium


Premium


Premium


Premium


Premium


Premium


Premium


Premium


Premium


Premium


Premium


Premium


Premium


Premium


Premium


Premium