- Home >
- Stock Photos >
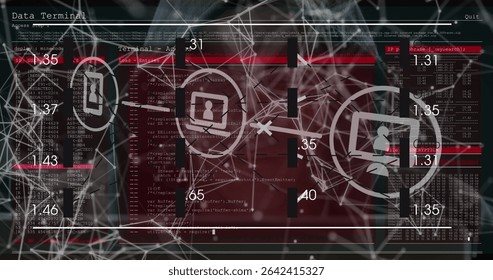
- Cybersecurity Dashboard with Data Analytics and Code Interface Visualization
Cybersecurity Dashboard with Data Analytics and Code Interface Visualization Image
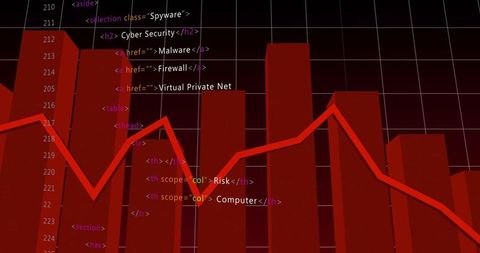
Digital visualization combining cybersecurity themes with HTML snippets and dynamic data representation concepts. Suitable for use in presentations about network security, technology strategies in cybersecurity firms, educational materials about data analytics and tech integration approaches. Can be used to illustrate tech blogs and articles regarding cyber threats analysis, software interface designs, and technical innovation discussions.
Powered by  - Get 15% off with code: PIKWIZARD15


downloads
Tags:
More
Credit Photo
If you would like to credit the Photo, here are some ways you can do so
Text Link
photo Link
<span class="text-link">
<span>
<a target="_blank" href=https://pikwizard.com/photo/cybersecurity-dashboard-with-data-analytics-and-code-interface-visualization/ac20cdeb4cd247bd1e540904a461b000/>PikWizard</a>
</span>
</span>
<span class="image-link">
<span
style="margin: 0 0 20px 0; display: inline-block; vertical-align: middle; width: 100%;"
>
<a
target="_blank"
href="https://pikwizard.com/photo/cybersecurity-dashboard-with-data-analytics-and-code-interface-visualization/ac20cdeb4cd247bd1e540904a461b000/"
style="text-decoration: none; font-size: 10px; margin: 0;"
>
<img src="https://pikwizard.com/pw/medium/ac20cdeb4cd247bd1e540904a461b000.jpg" style="margin: 0; width: 100%;" alt="" />
<p style="font-size: 12px; margin: 0;">PikWizard</p>
</a>
</span>
</span>
Free (free of charge)
Free for personal and commercial use.
Author: Authentic Images