- Home >
- Stock Photos >
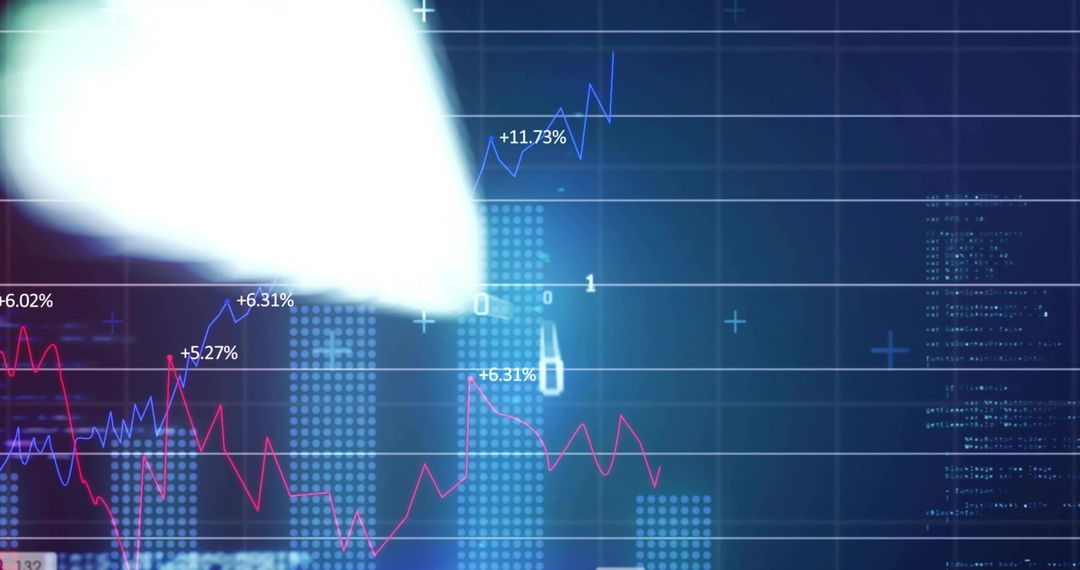
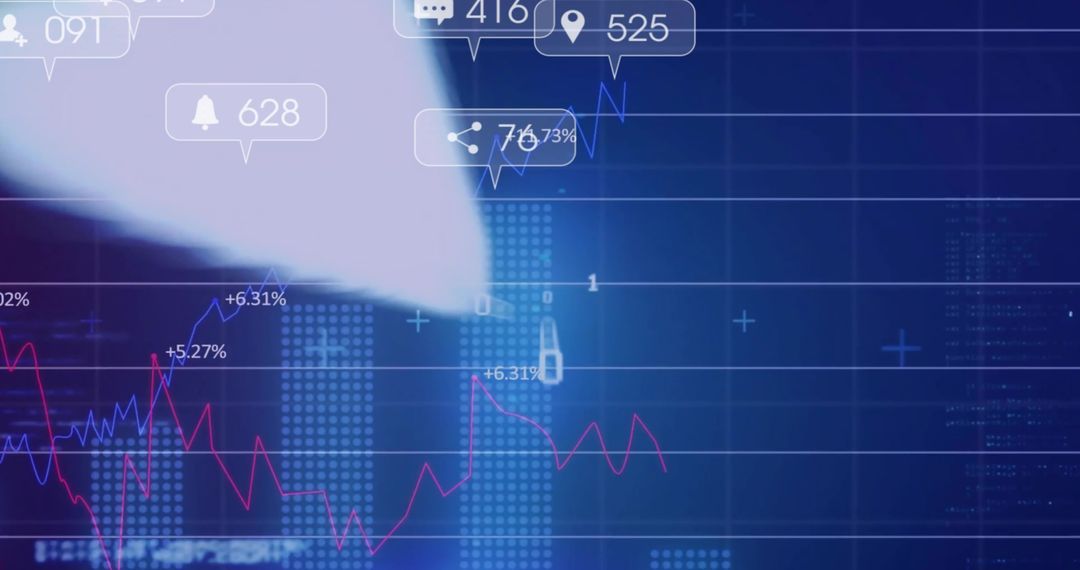
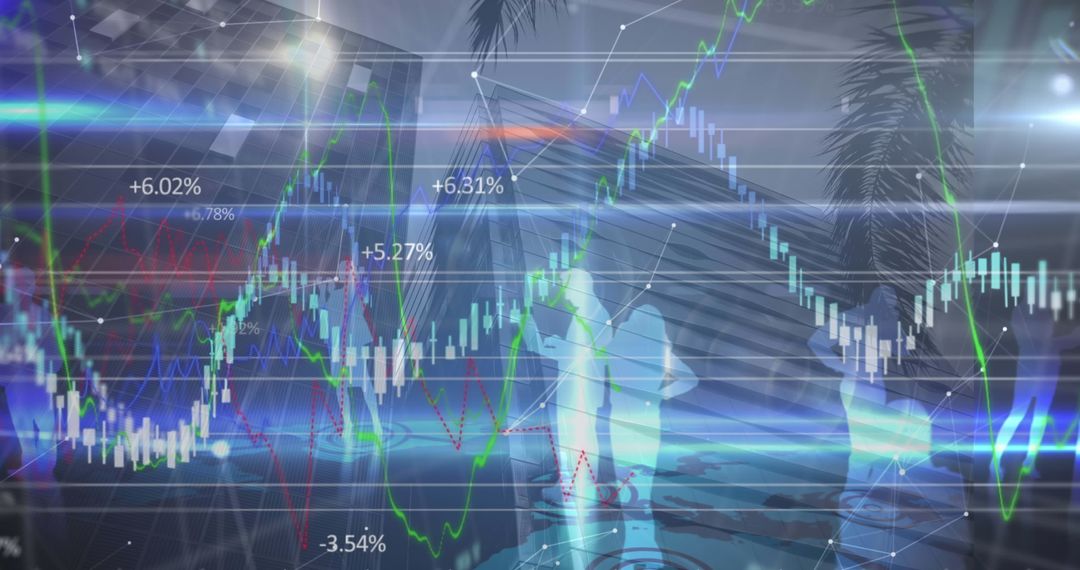
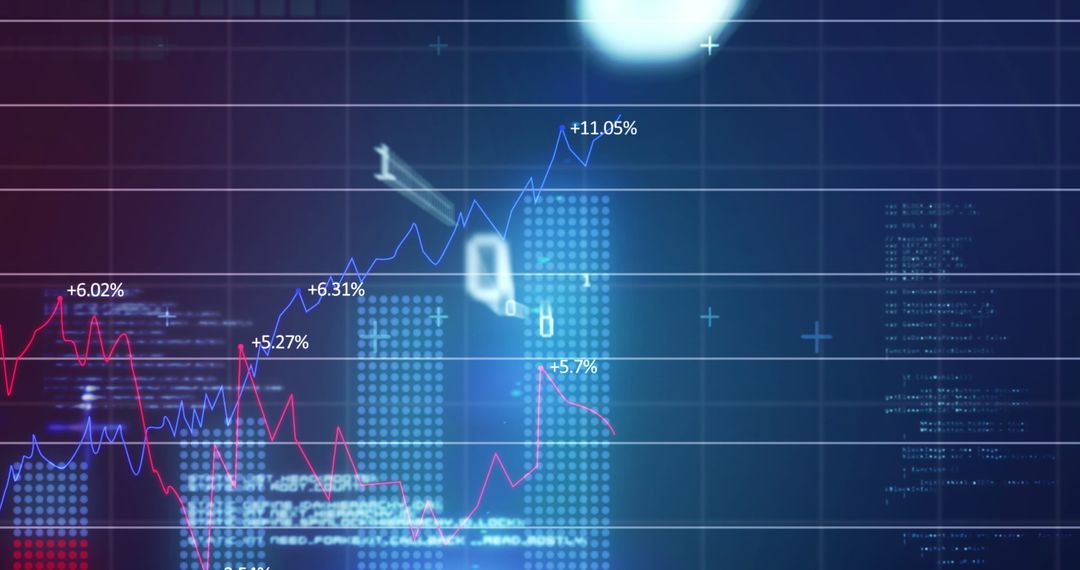
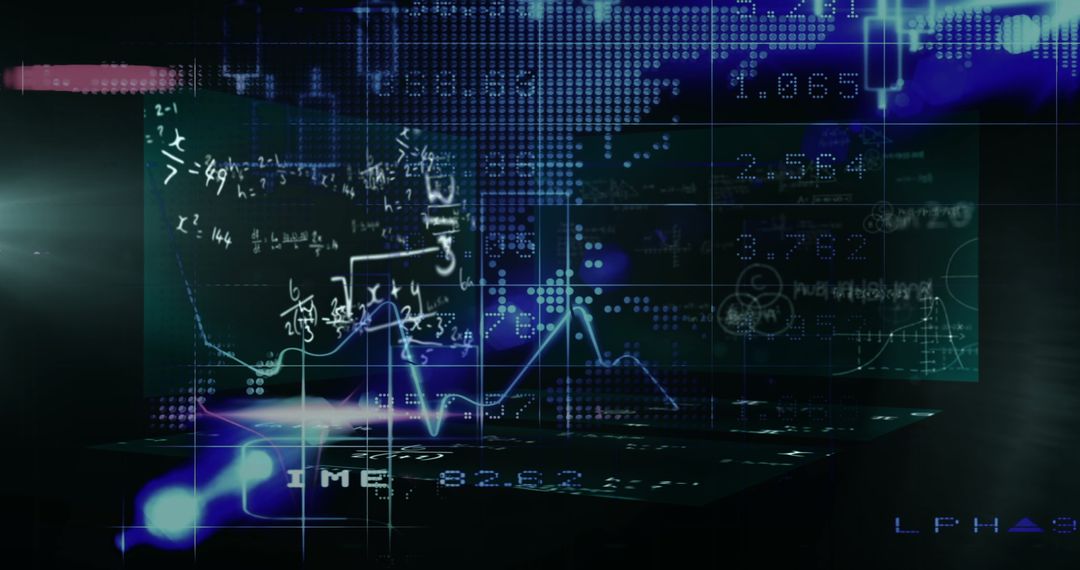
- Cybersecurity HUD dashboard showing charts, percentages and data visualization
Cybersecurity HUD dashboard showing charts, percentages and data visualization Image

Abstract cybersecurity dashboard displaying circular HUD element at right, overlaying colored line charts, percentage labels, data points, grid and faint world map. Soft bluish tones with magenta and cyan chart lines, horizontal guide lines creating technical, modern feel. Conveying data monitoring, network protection and financial analytics. Showing upward and downward trends with percentage callouts for stock or KPI visualization. Ideal for presentations on cyber security, financial analytics, stock performance, risk monitoring, IT operations and threat intelligence. Use for website hero banners, software landing pages, corporate reports, technology blog headers, app splash screens and slides. Leaving left side copy space for headline or logo. Recommend widescreen crop for banner use and high-resolution export for print or web.
Powered by  - Get 15% off with code: PIKWIZARD15


0
downloads
downloads
Tags:
More
Credit Photo
If you would like to credit the Photo, here are some ways you can do so
Text Link
photo Link
<span class="text-link">
<span>
<a target="_blank" href=https://pikwizard.com/photo/cybersecurity-hud-dashboard-showing-charts-percentages-and-data-visualization/26513f1d576b910ef4e3f211d5445bde/>PikWizard</a>
</span>
</span>
<span class="image-link">
<span
style="margin: 0 0 20px 0; display: inline-block; vertical-align: middle; width: 100%;"
>
<a
target="_blank"
href="https://pikwizard.com/photo/cybersecurity-hud-dashboard-showing-charts-percentages-and-data-visualization/26513f1d576b910ef4e3f211d5445bde/"
style="text-decoration: none; font-size: 10px; margin: 0;"
>
<img src="https://pikwizard.com/pw/medium/26513f1d576b910ef4e3f211d5445bde.jpg" style="margin: 0; width: 100%;" alt="" />
<p style="font-size: 12px; margin: 0;">PikWizard</p>
</a>
</span>
</span>
Free (free of charge)
Free for personal and commercial use.
Author: People Creations
Similar Free Stock Images

Premium


Premium


Premium


Premium


Premium


Premium


Premium


Premium


Premium


Premium


Premium


Premium


Premium


Premium


Premium


Premium


Premium


Premium


Premium


Premium


Premium


Premium


Premium


Premium