- Home >
- Stock Photos >
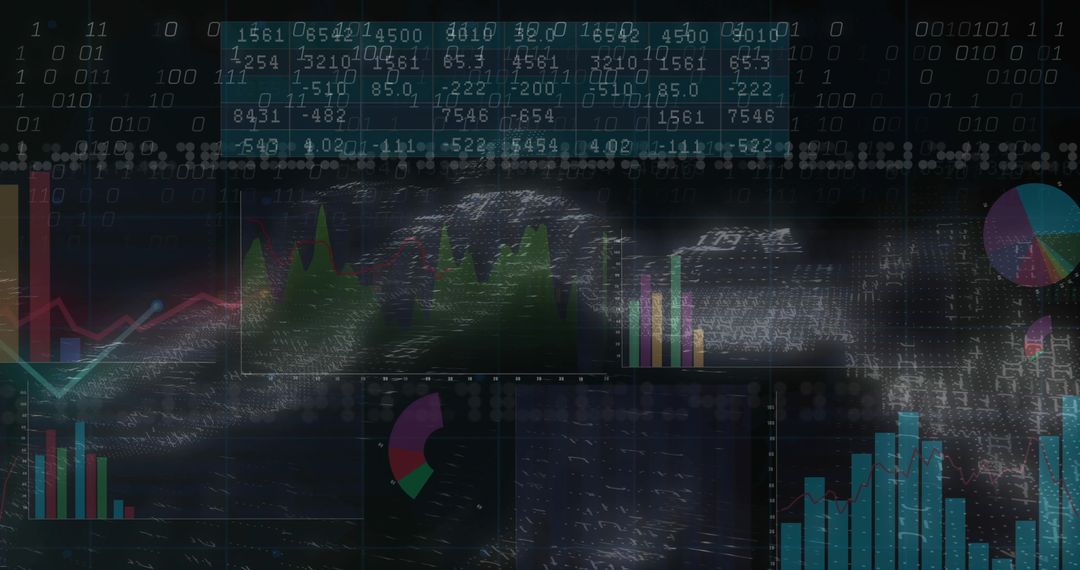
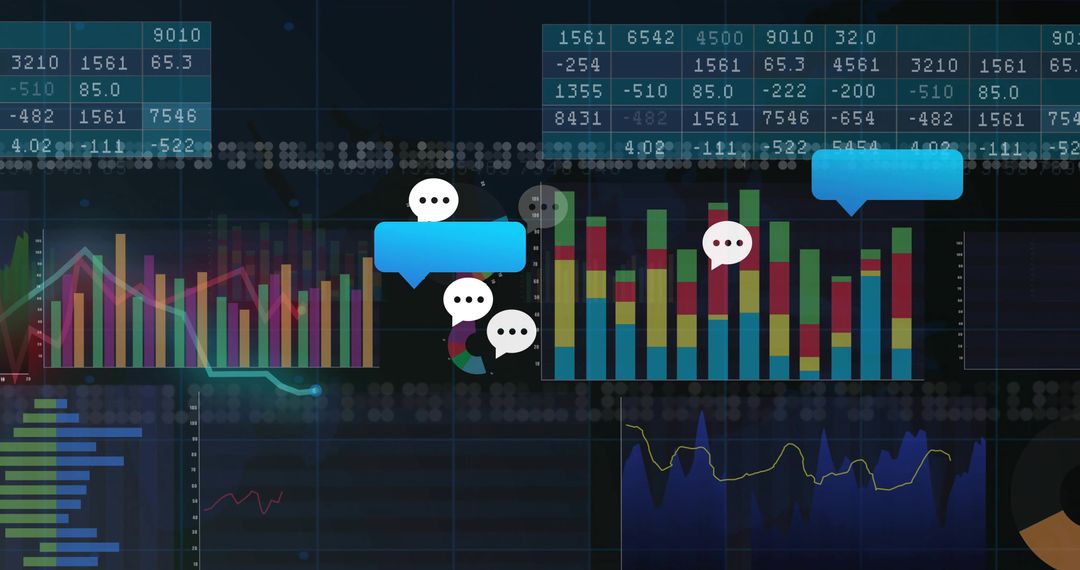
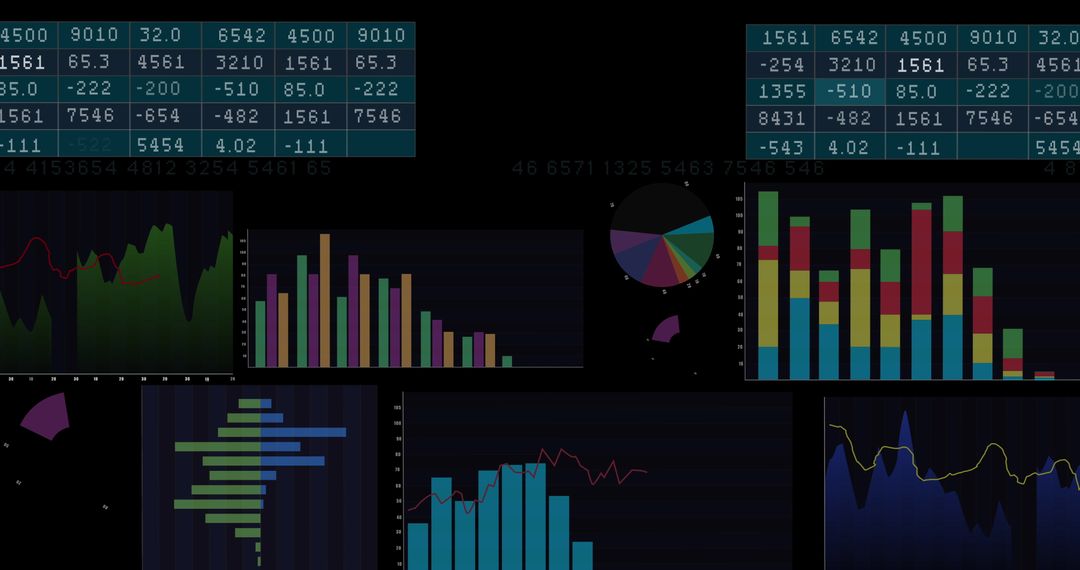
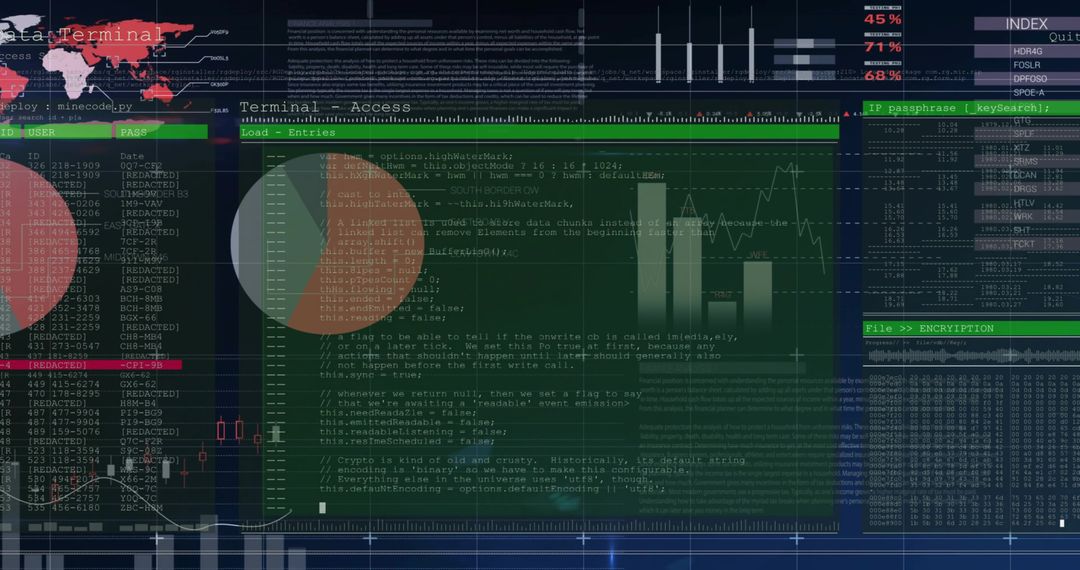
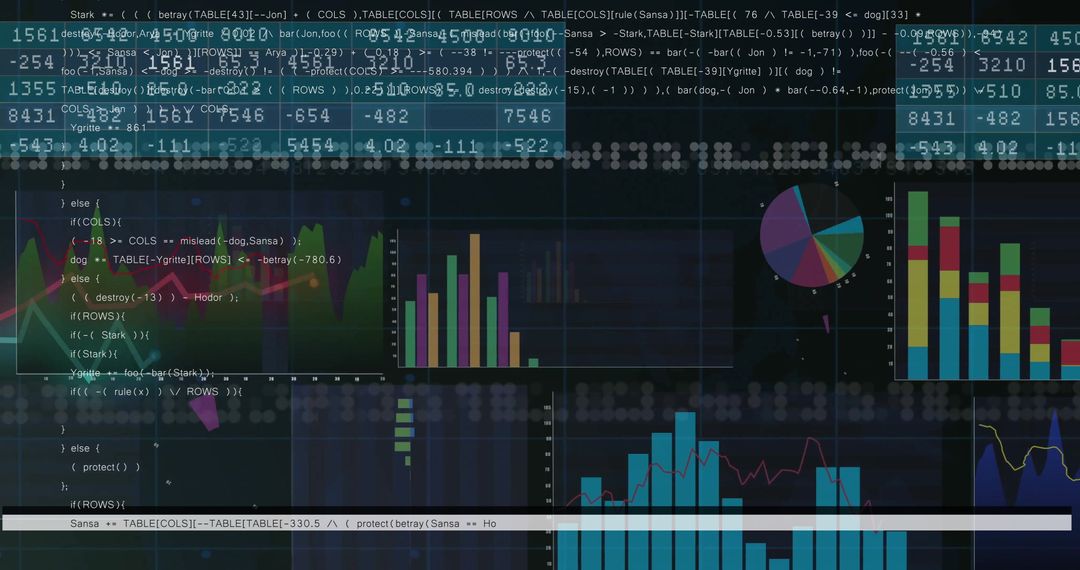
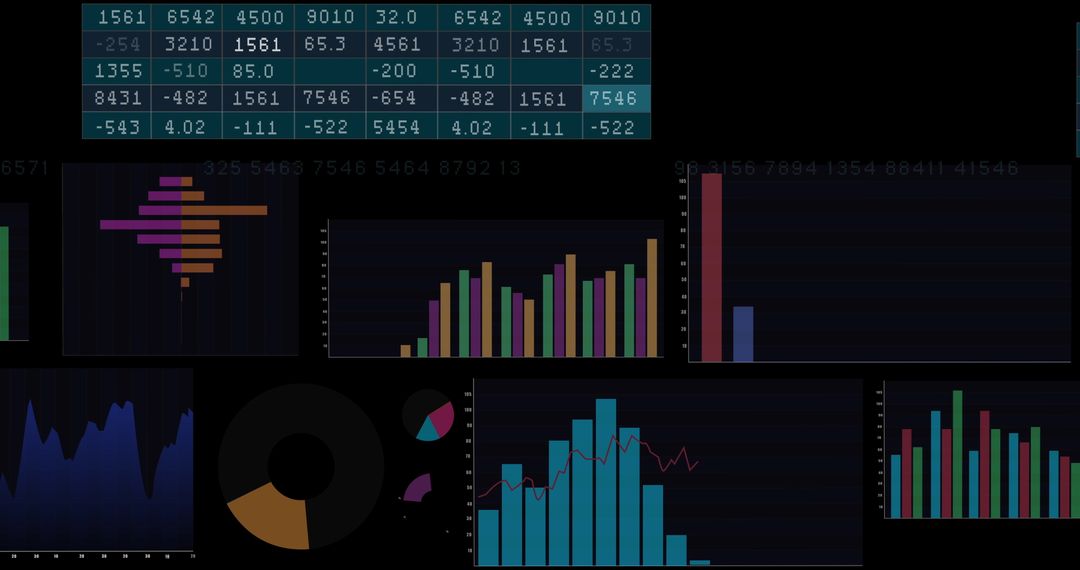
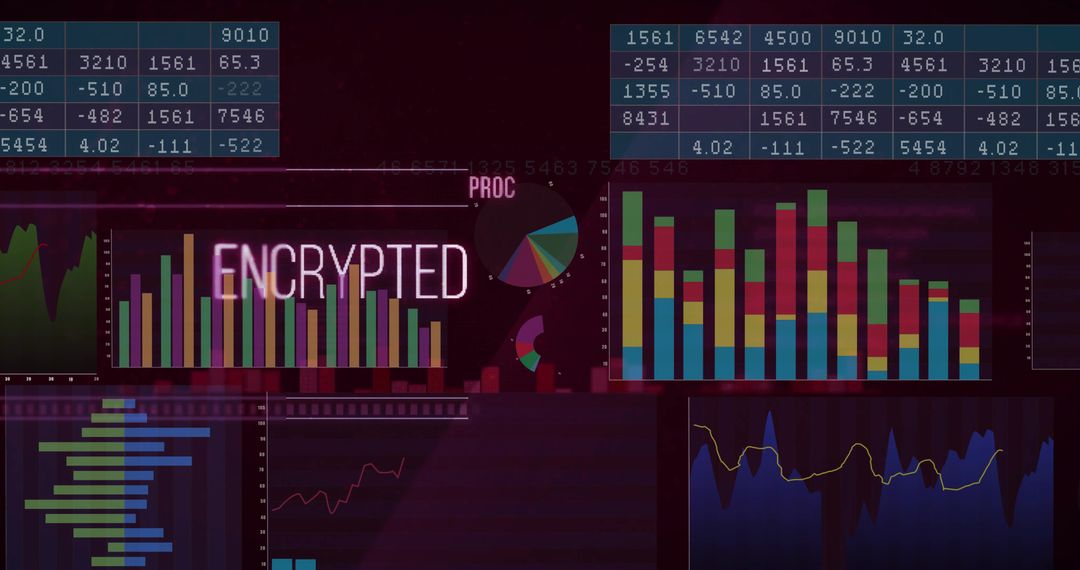
- Dark Analytics Dashboard Displaying Financial Charts, Metrics and Neon Interface
Dark Analytics Dashboard Displaying Financial Charts, Metrics and Neon Interface Image

Dark analytics dashboard displaying numeric matrix, multicolor bar charts, area chart and donut visualization over deep grid layout. Featuring neon accents and dark theme, creating futuristic tech mood and high-contrast readability. Serving fintech interfaces, enhancing data-driven presentations, supporting investor decks, anchoring corporate reporting and illustrating UI concept demos while powering technology marketing backgrounds. Working well for website headers, slide covers, social media banners, blog illustrations and product landing pages to convey analytics, performance and KPI storytelling. High-resolution and easily customizable for color and overlay adjustments.
Powered by  - Get 15% off with code: PIKWIZARD15


0
downloads
downloads
Tags:
More
Credit Photo
If you would like to credit the Photo, here are some ways you can do so
Text Link
photo Link
<span class="text-link">
<span>
<a target="_blank" href=https://pikwizard.com/photo/dark-analytics-dashboard-displaying-financial-charts-metrics-and-neon-interface/d3331b034803c1fff9dcde5a2c4ce72a/>PikWizard</a>
</span>
</span>
<span class="image-link">
<span
style="margin: 0 0 20px 0; display: inline-block; vertical-align: middle; width: 100%;"
>
<a
target="_blank"
href="https://pikwizard.com/photo/dark-analytics-dashboard-displaying-financial-charts-metrics-and-neon-interface/d3331b034803c1fff9dcde5a2c4ce72a/"
style="text-decoration: none; font-size: 10px; margin: 0;"
>
<img src="https://pikwizard.com/pw/medium/d3331b034803c1fff9dcde5a2c4ce72a.jpg" style="margin: 0; width: 100%;" alt="" />
<p style="font-size: 12px; margin: 0;">PikWizard</p>
</a>
</span>
</span>
Free (free of charge)
Free for personal and commercial use.
Author: Creative Art
Similar Free Stock Images

Premium


Premium


Premium


Premium


Premium


Premium

Premium


Premium


Premium


Premium


Premium


Premium


Premium


Premium


Premium


Premium


Premium


Premium


Premium


Premium


Premium


Premium


Premium


Premium