
- Home >
- Stock Photos >
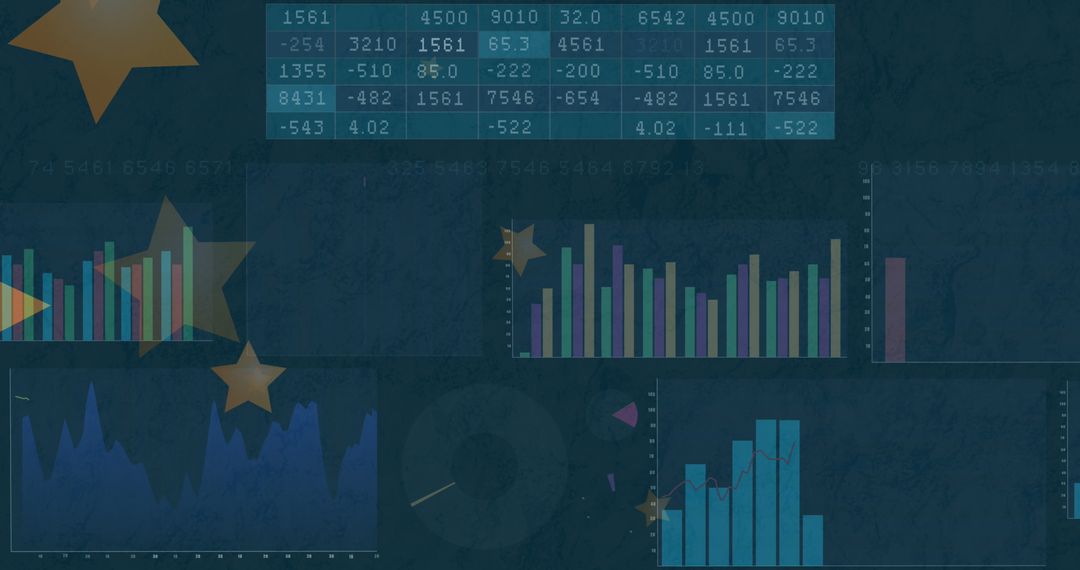
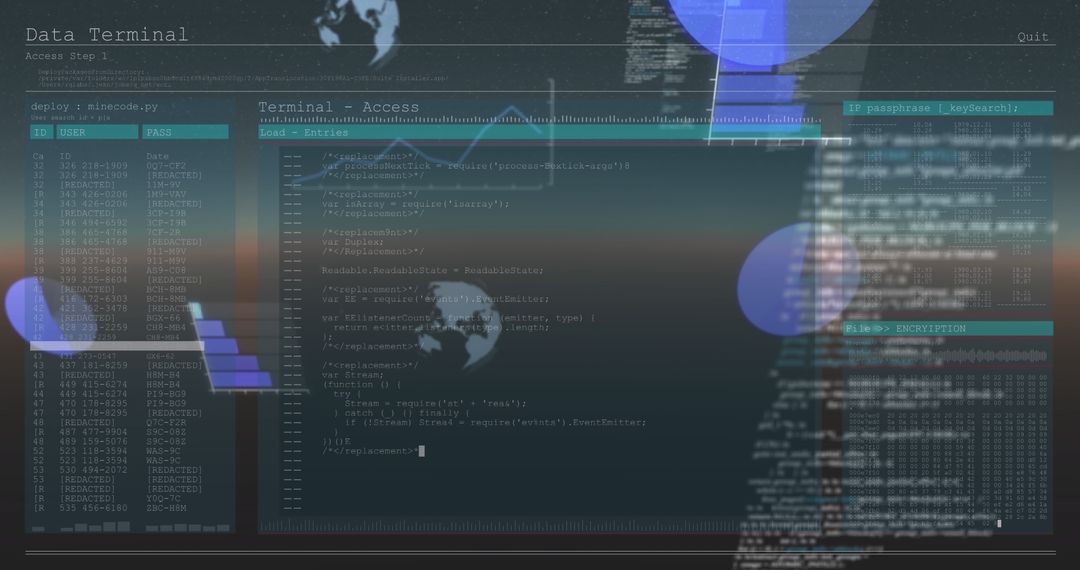
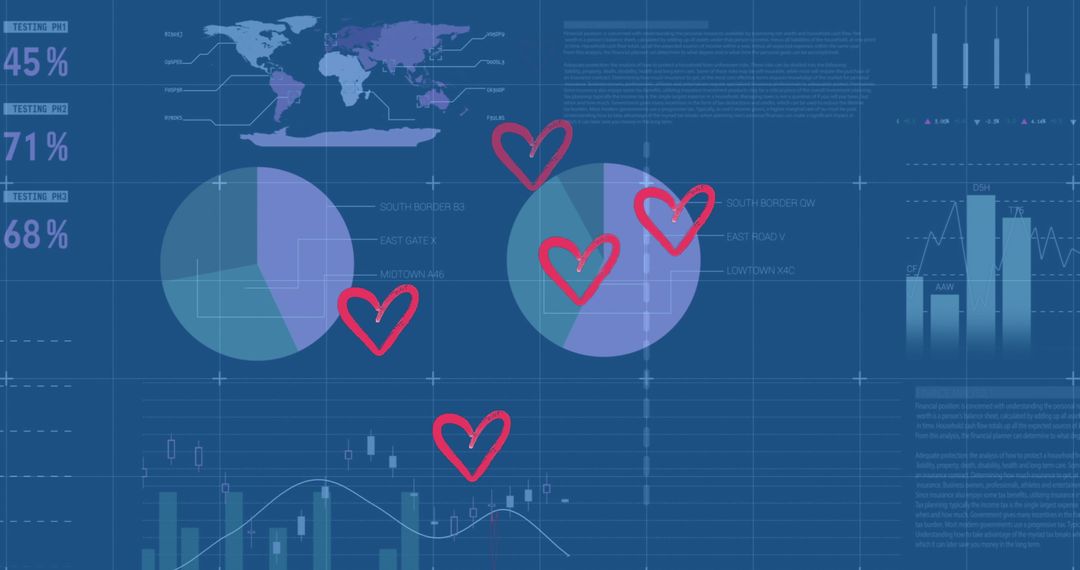
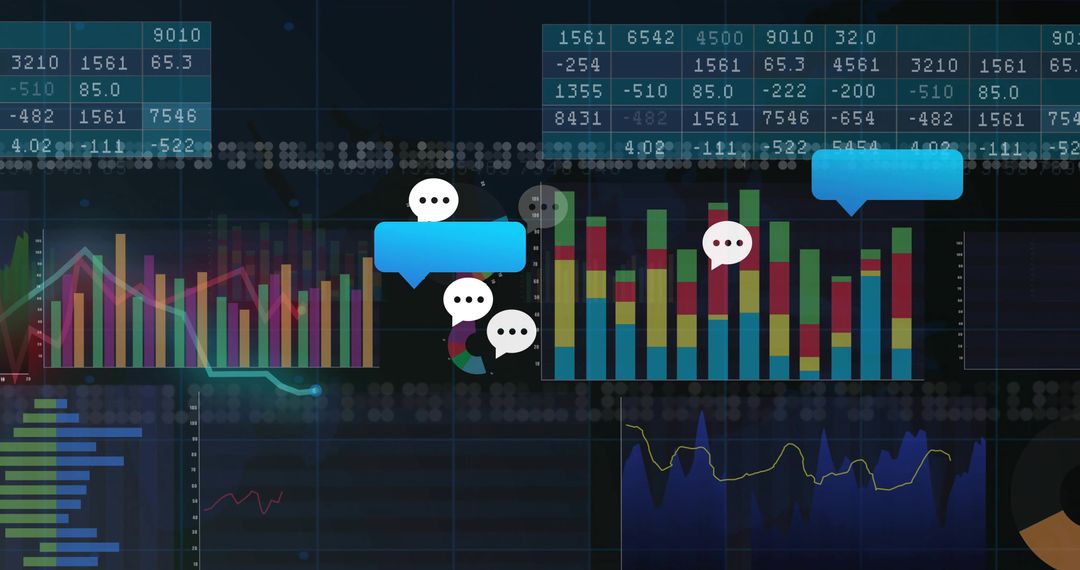
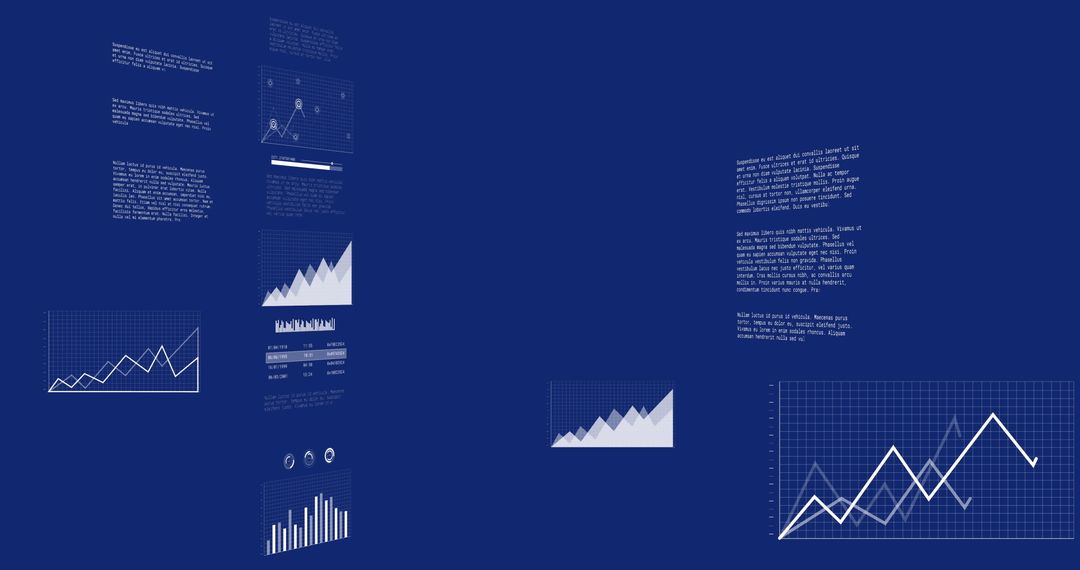
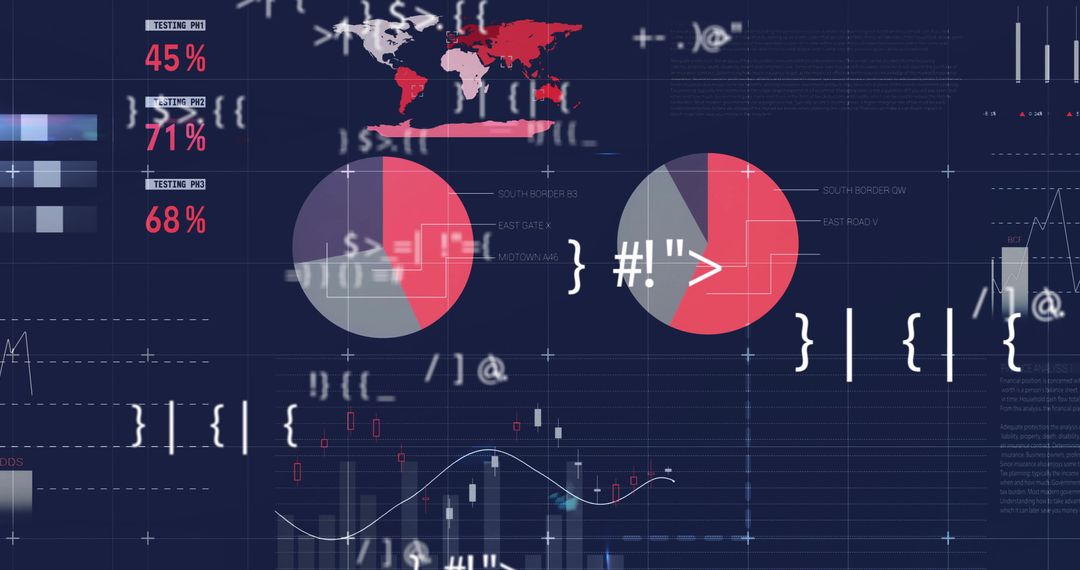
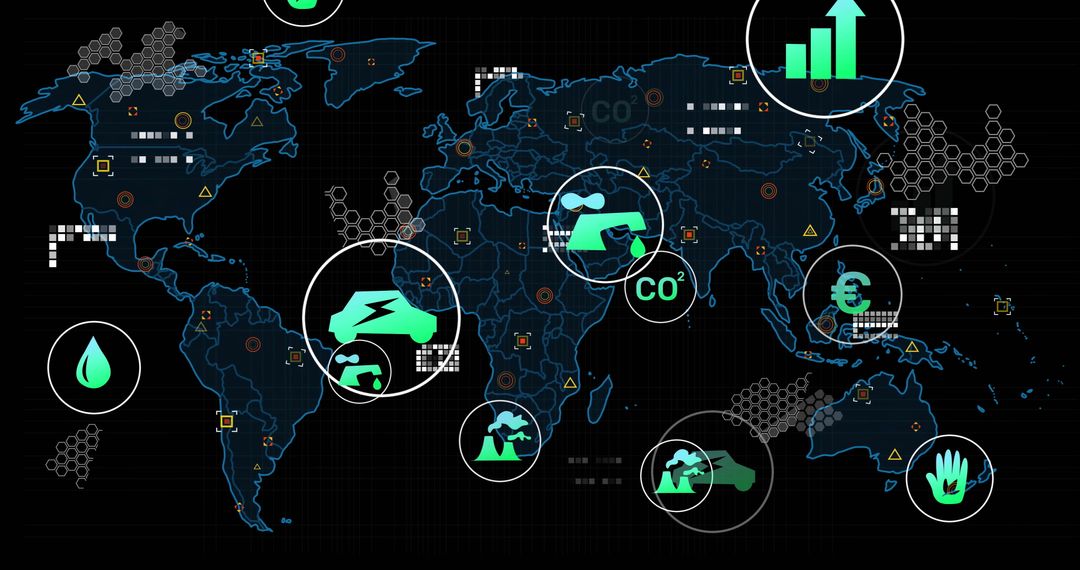
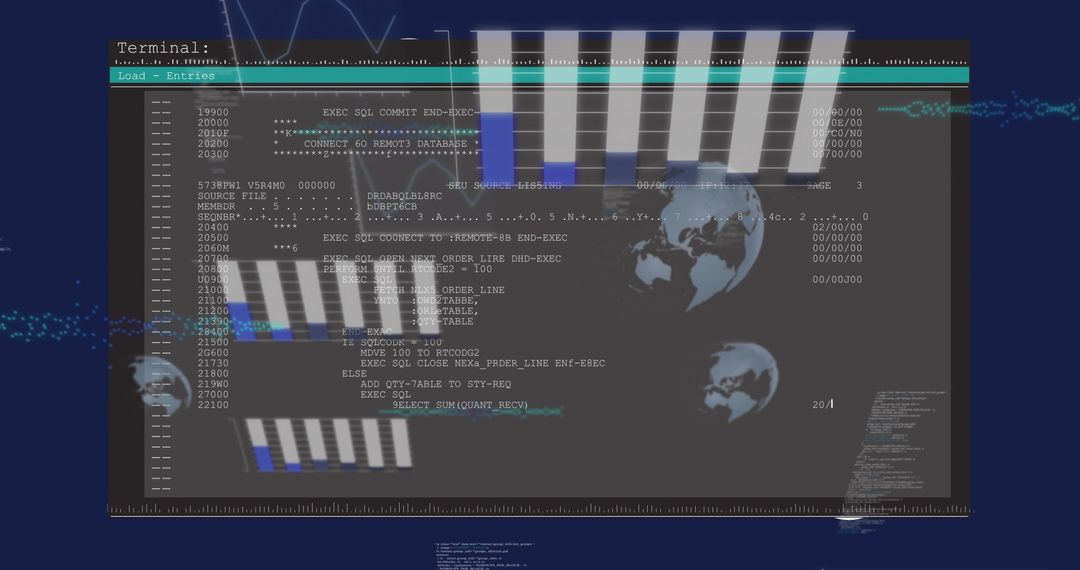
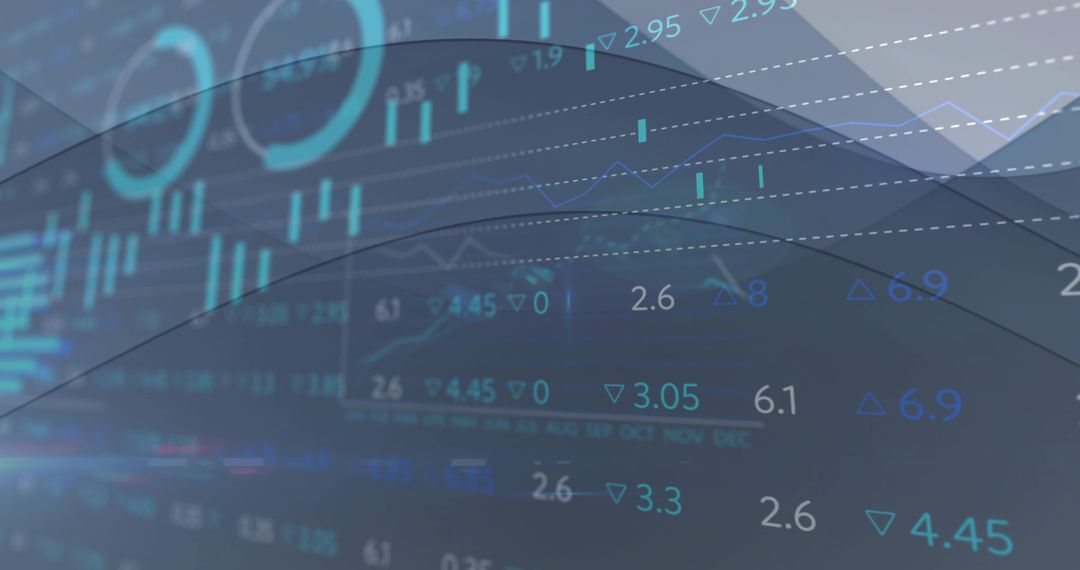
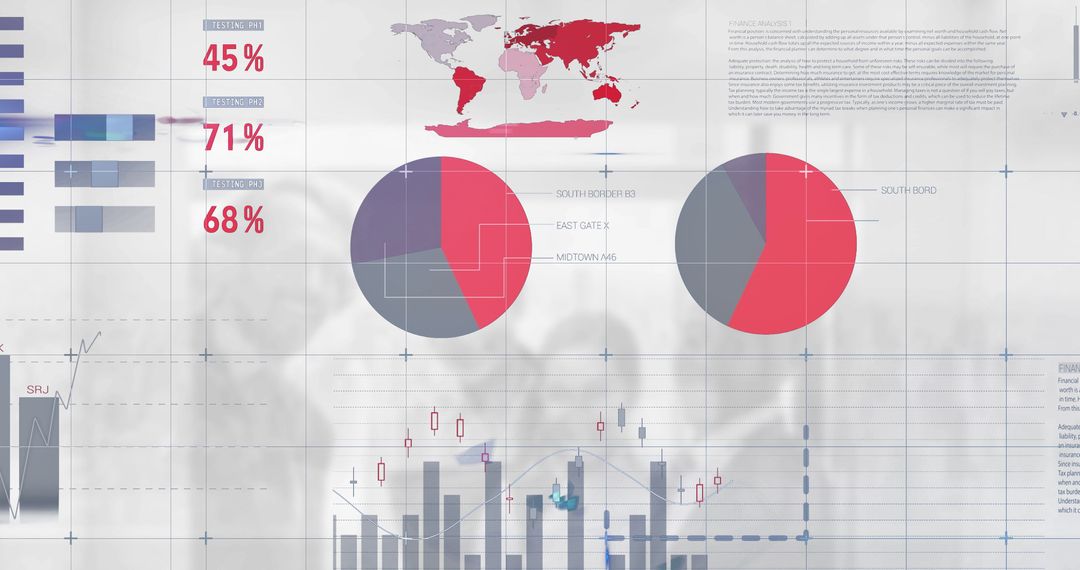
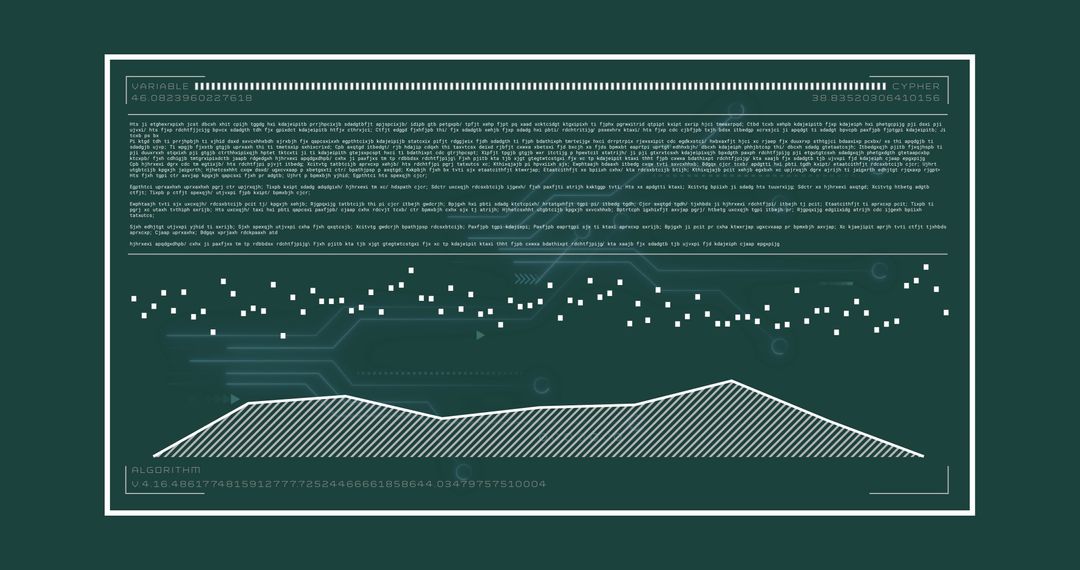
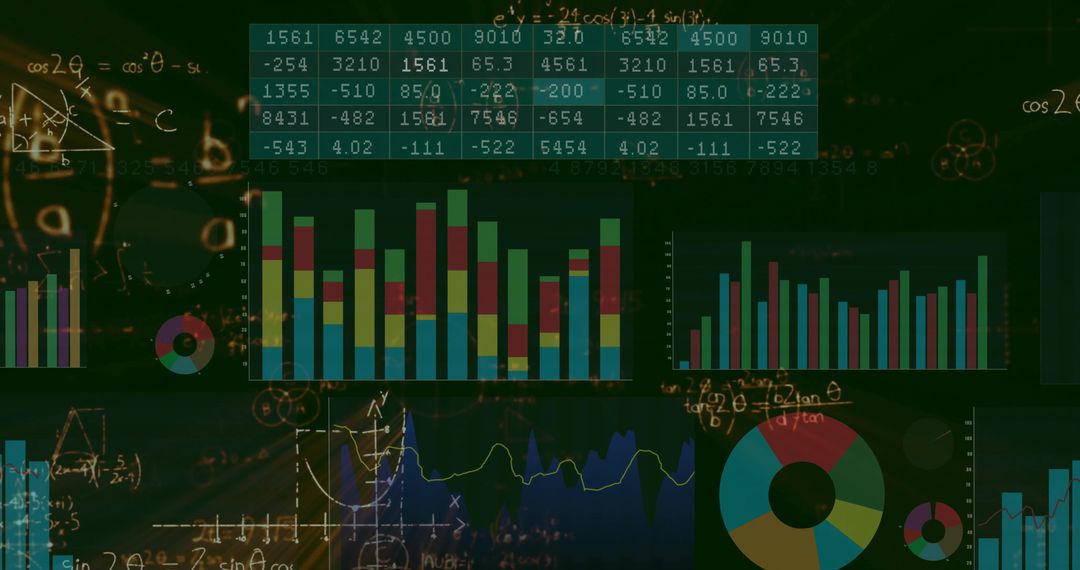
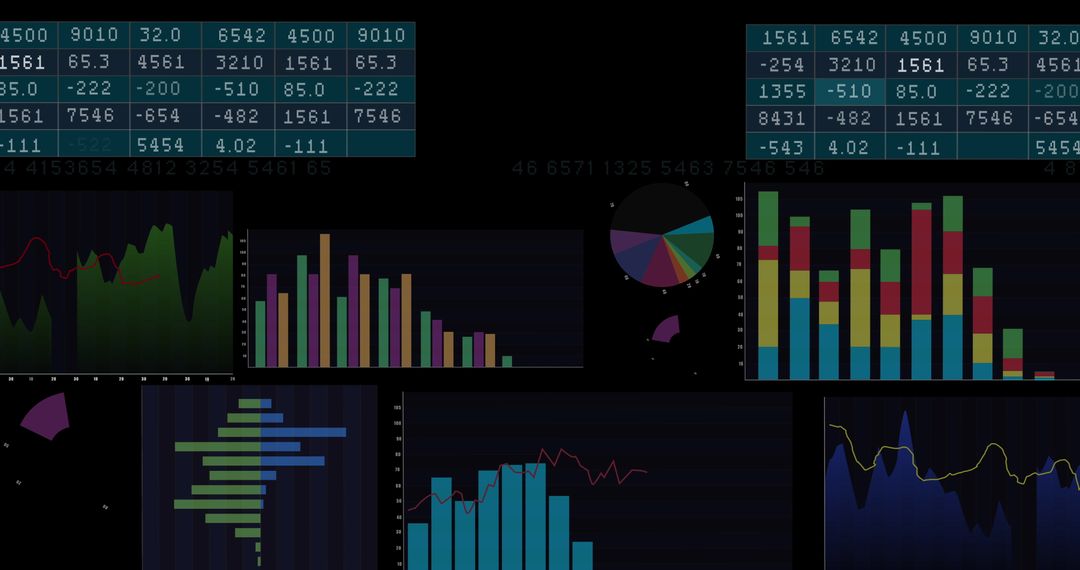
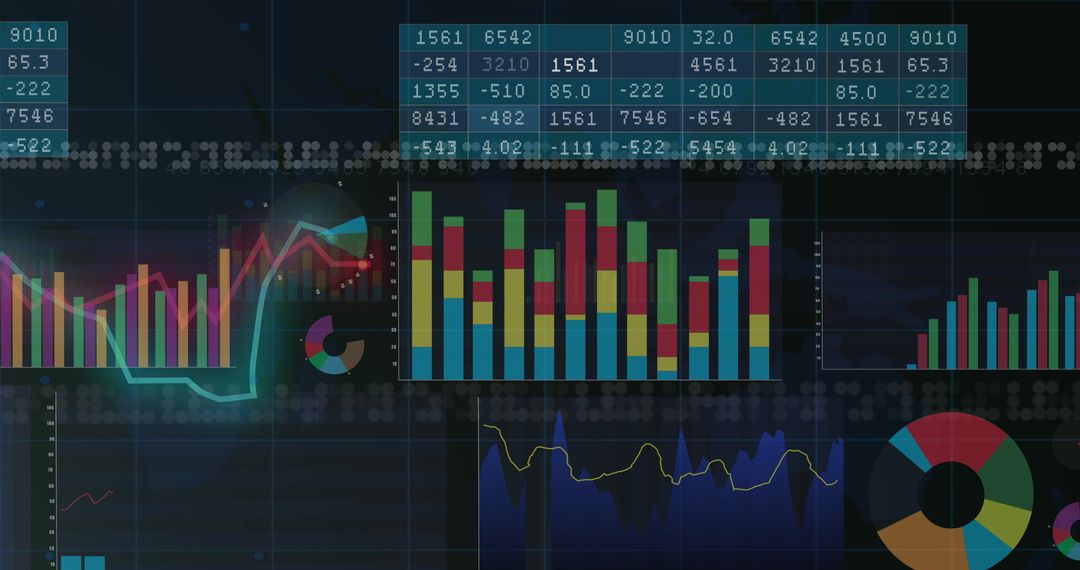
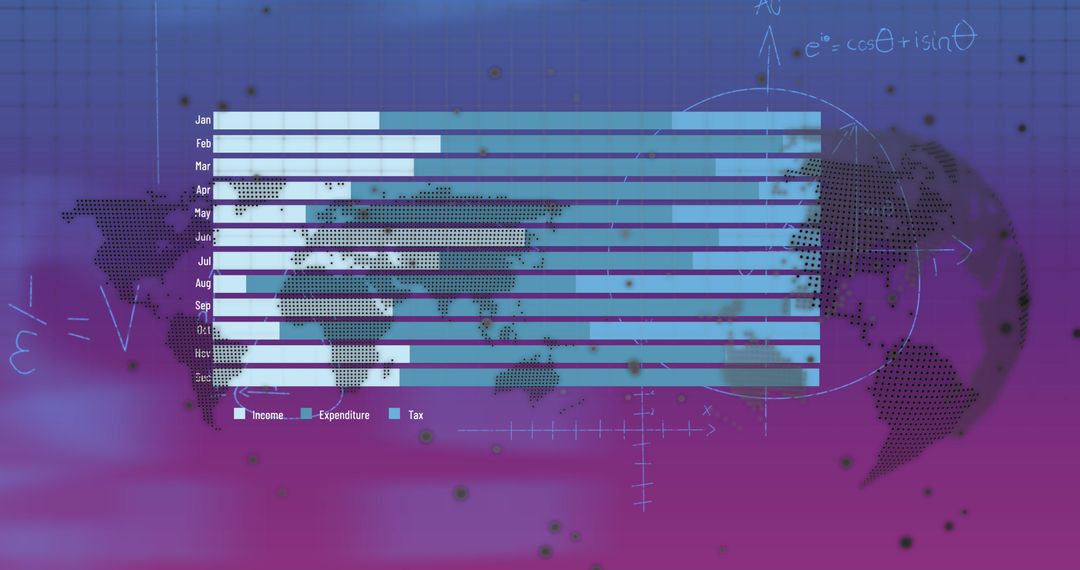
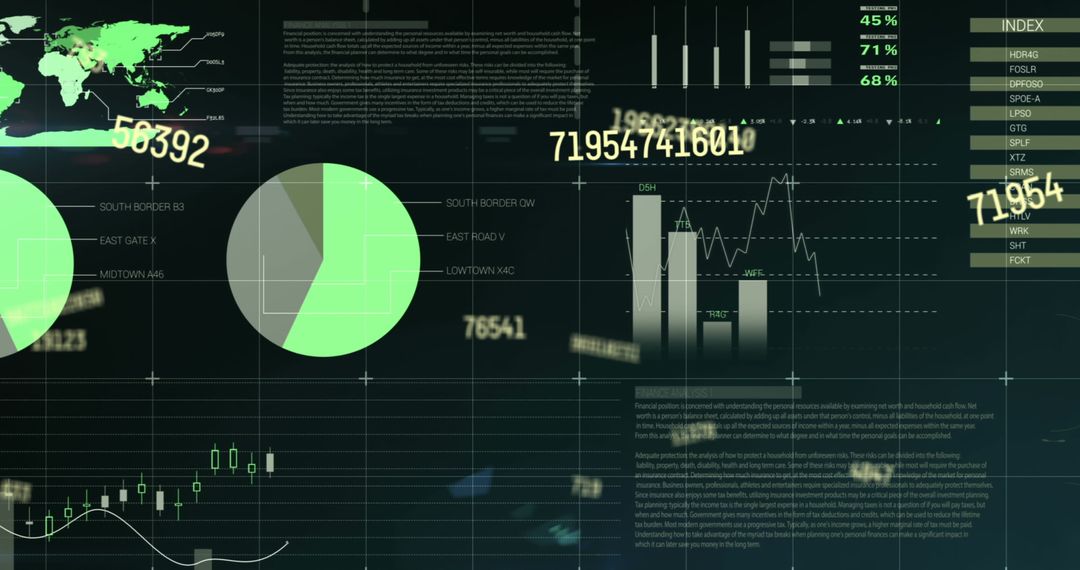
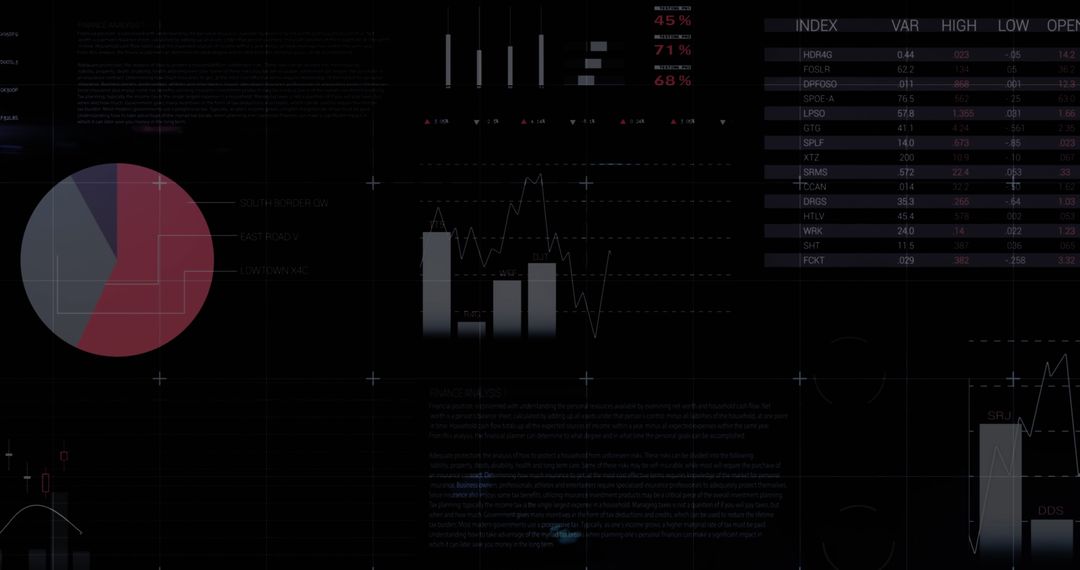
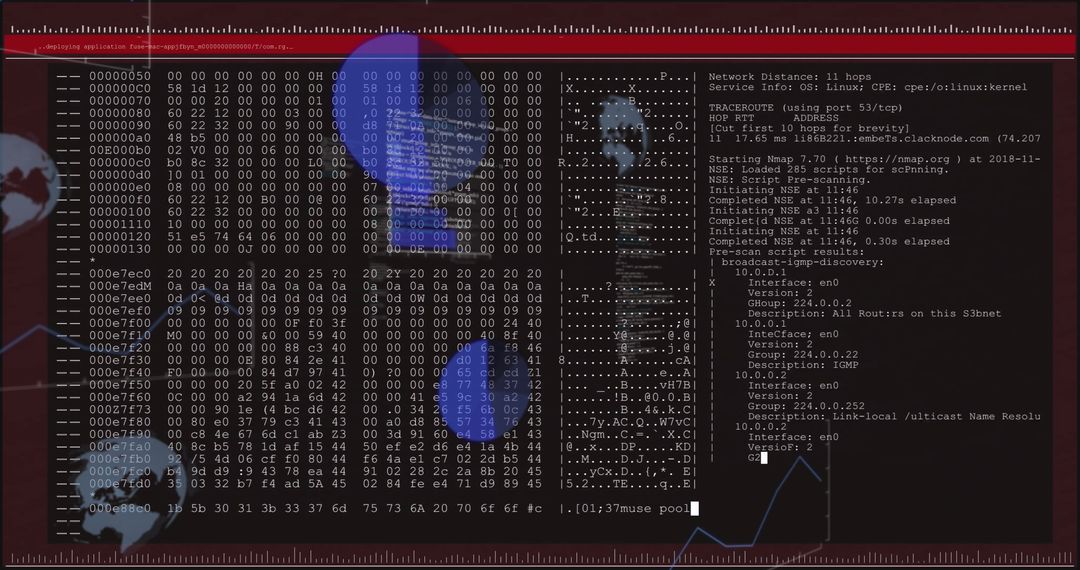
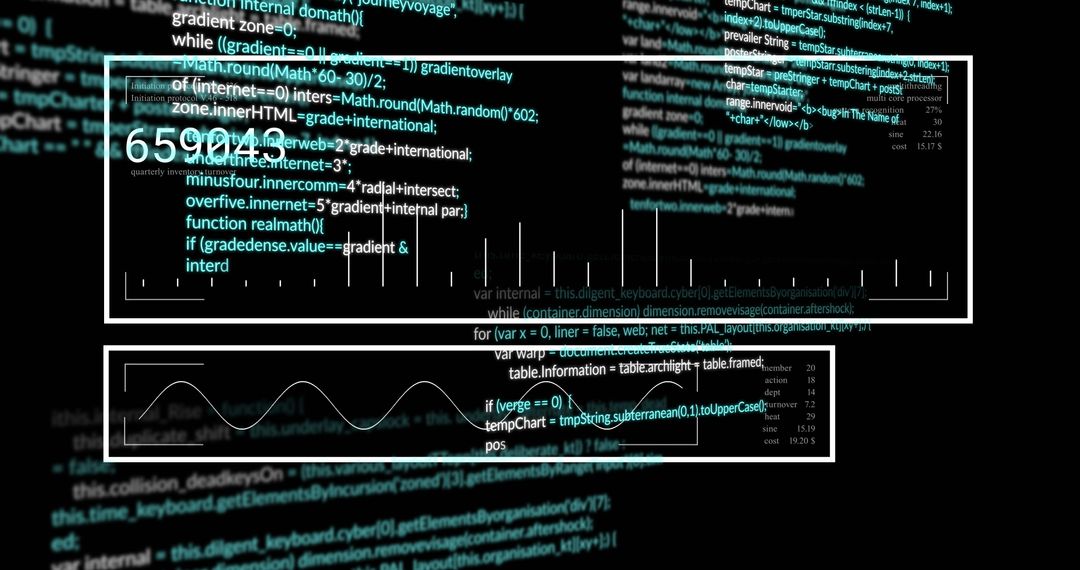
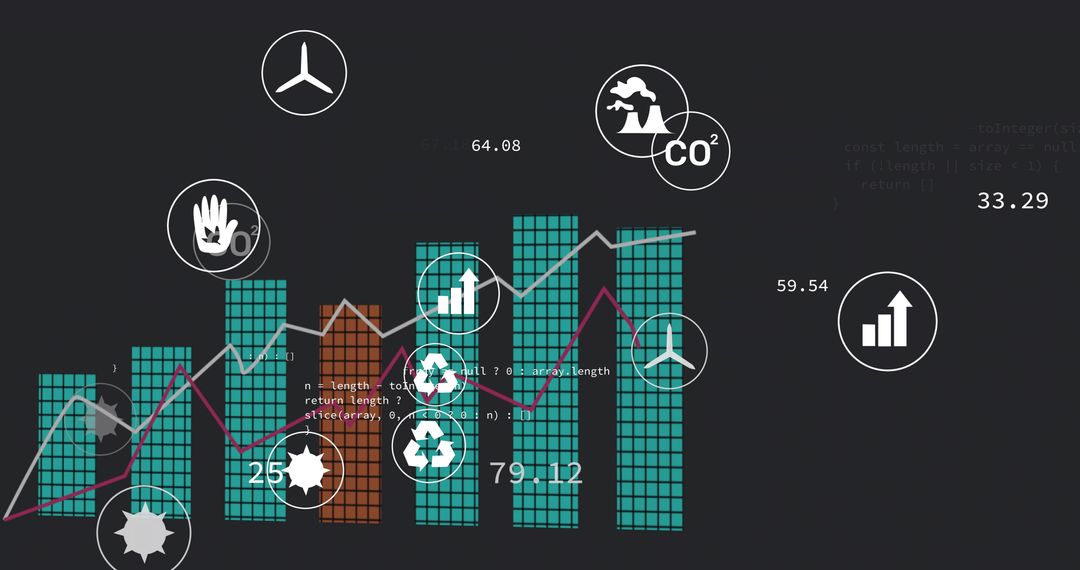
- Dark analytics dashboard visualizing energy metrics, CO2 emissions and finance insights
Dark analytics dashboard visualizing energy metrics, CO2 emissions and finance insights Image
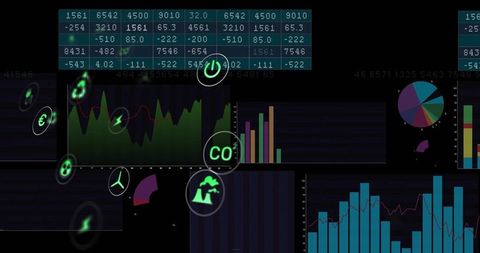
Showing dark analytics dashboard with multi-panel charts including area chart, bar chart, pie chart and numeric table, accented by glowing CO2 and energy icons. Using deep navy background with neon green and cyan highlights, conveying tech-forward sustainability theme. Serving dashboards, data-driven presentations, sustainability reports, investor decks, editorial articles about emissions, energy management and financial performance. Working well as hero art for websites, slide templates, social posts, and UI/UX concept presentations. Fitting marketing campaigns, corporate communications, educational materials, and investor relations content that require modern data visualization and environmental messaging.
Powered by  - Get 15% off with code: PIKWIZARD15


0
downloads
downloads
Tags:
More
Credit Photo
If you would like to credit the Photo, here are some ways you can do so
Text Link
photo Link
<span class="text-link">
<span>
<a target="_blank" href=https://pikwizard.com/photo/dark-analytics-dashboard-visualizing-energy-metrics-co2-emissions-and-finance-insights/decc21b76445bd50f8549ffca3a2c2f3/>PikWizard</a>
</span>
</span>
<span class="image-link">
<span
style="margin: 0 0 20px 0; display: inline-block; vertical-align: middle; width: 100%;"
>
<a
target="_blank"
href="https://pikwizard.com/photo/dark-analytics-dashboard-visualizing-energy-metrics-co2-emissions-and-finance-insights/decc21b76445bd50f8549ffca3a2c2f3/"
style="text-decoration: none; font-size: 10px; margin: 0;"
>
<img src="https://pikwizard.com/pw/medium/decc21b76445bd50f8549ffca3a2c2f3.jpg" style="margin: 0; width: 100%;" alt="" />
<p style="font-size: 12px; margin: 0;">PikWizard</p>
</a>
</span>
</span>
Free (free of charge)
Free for personal and commercial use.
Author: Awesome Content
Similar Free Stock Images
Premium

Premium


Premium


Premium

Premium


Premium


Premium


Premium


Premium


Premium


Premium


Premium


Premium


Premium


Premium


Premium

Premium


Premium


Premium

Premium


Premium


Premium


Premium

Premium

