- Home >
- Stock Photos >
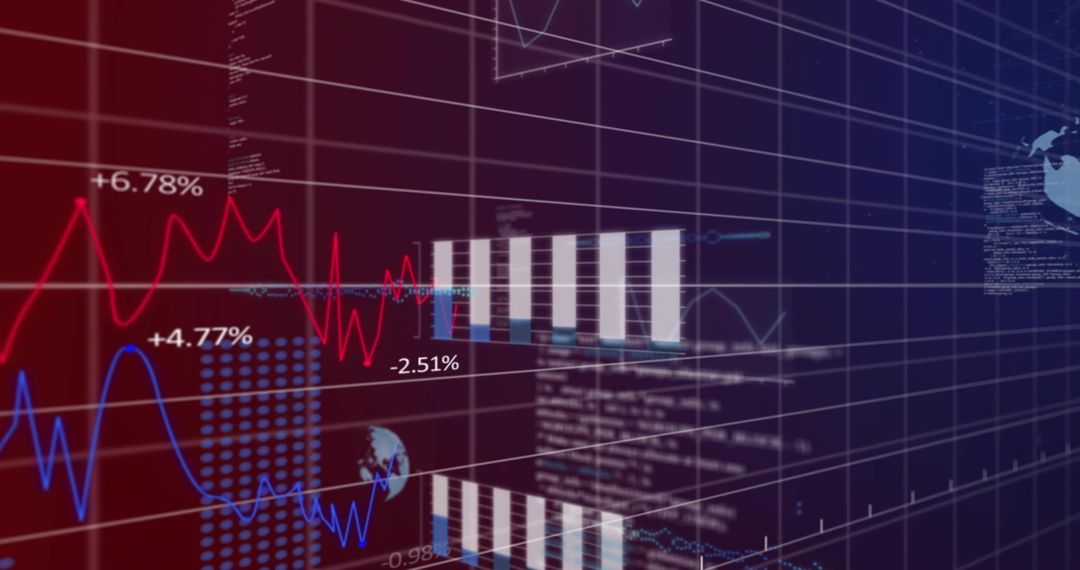
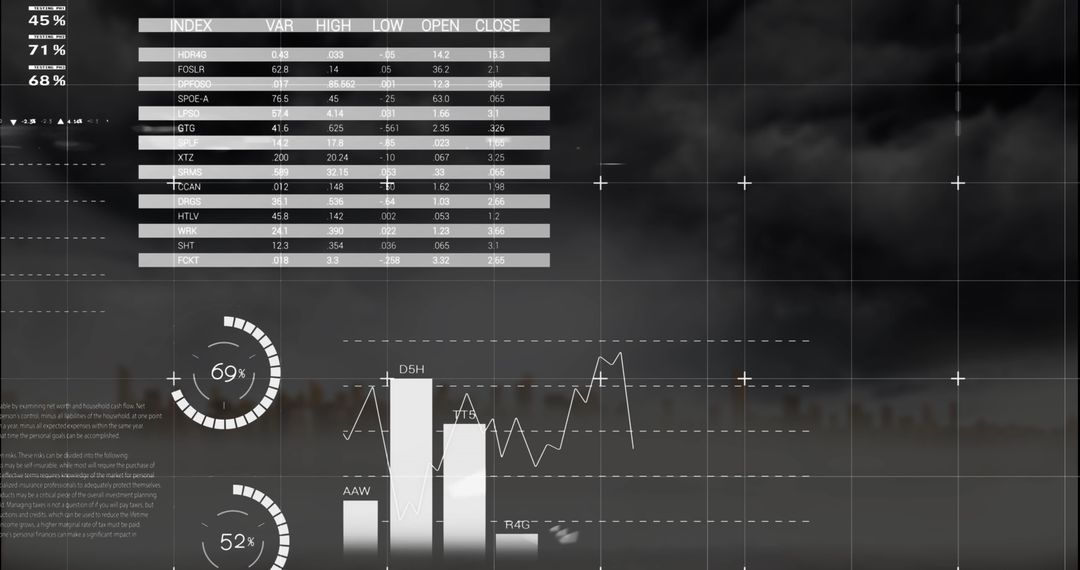
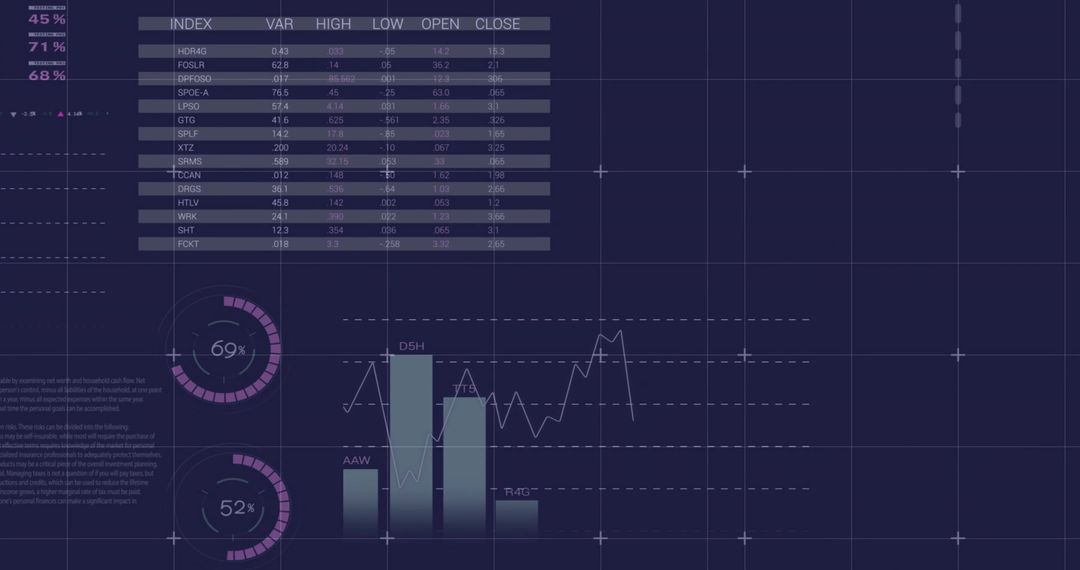
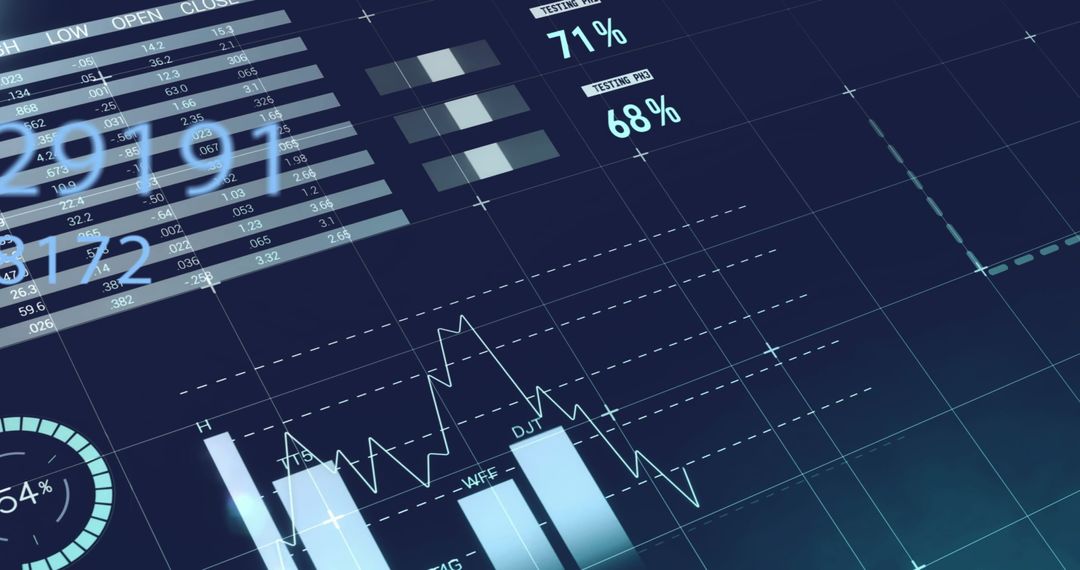
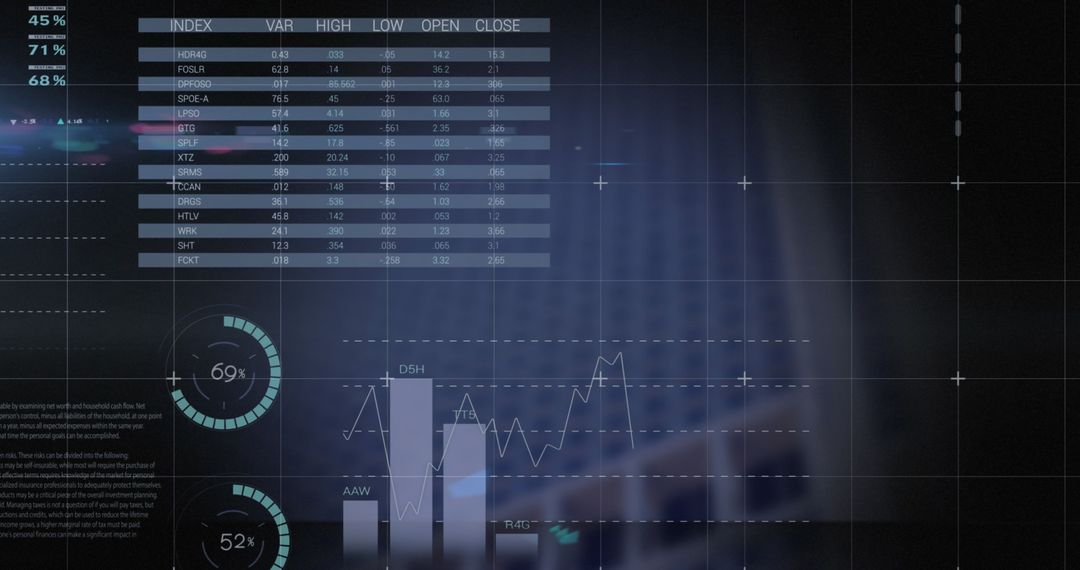
- Dark Blue Financial Dashboard Showing Index Table, Line Graphs, Bar Charts and Gauges
Dark Blue Financial Dashboard Showing Index Table, Line Graphs, Bar Charts and Gauges Image
Showing dark-blue analytics dashboard on left with index table, vertical bar chart, jagged line chart and circular progress gauges over subtle grid. Featuring crisp typography, muted highlights and high-contrast data elements for clear readability. Using modern HUD-style interface suitable for finance, trading, analytics, monitoring and technology projects. Working well for presentations, pitch decks, investor reports, website headers, app demos and marketing materials. Suggested uses include hero banners, dashboard mockups, visual storytelling for business articles and animated video intros. Combining with branded color accents and clear data labels for customization and on-brand dashboards.
Powered by 


0
downloads
downloads
Tags:
More
Credit Photo
If you would like to credit the Photo, here are some ways you can do so
Text Link
photo Link
<span class="text-link">
<span>
<a target="_blank" href=https://pikwizard.com/photo/dark-blue-financial-dashboard-showing-index-table-line-graphs-bar-charts-and-gauges/ab3f27d8c1710f5a707d8e2fc3ce6651/>PikWizard</a>
</span>
</span>
<span class="image-link">
<span
style="margin: 0 0 20px 0; display: inline-block; vertical-align: middle; width: 100%;"
>
<a
target="_blank"
href="https://pikwizard.com/photo/dark-blue-financial-dashboard-showing-index-table-line-graphs-bar-charts-and-gauges/ab3f27d8c1710f5a707d8e2fc3ce6651/"
style="text-decoration: none; font-size: 10px; margin: 0;"
>
<img src="https://pikwizard.com/pw/medium/ab3f27d8c1710f5a707d8e2fc3ce6651.jpg" style="margin: 0; width: 100%;" alt="" />
<p style="font-size: 12px; margin: 0;">PikWizard</p>
</a>
</span>
</span>
Free (free of charge)
Free for personal and commercial use.
Author: People Creations
Similar Free Stock Images

Premium


Premium


Premium


Premium


Premium


Premium


Premium


Premium


Premium


Premium


Premium


Premium


Premium


Premium


Premium


Premium


Premium


Premium


Premium


Premium


Premium


Premium


Premium


Premium