
- Home >
- Stock Photos >
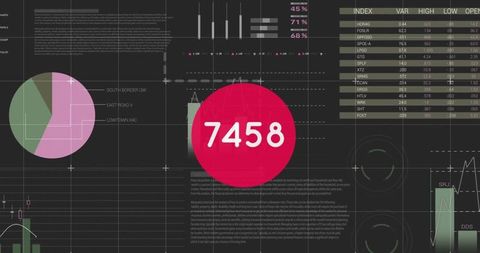
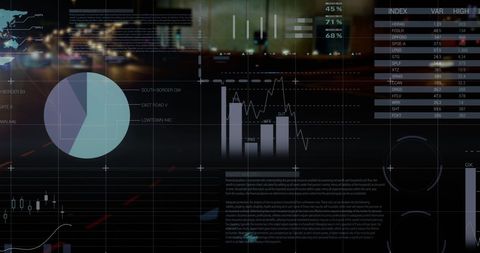
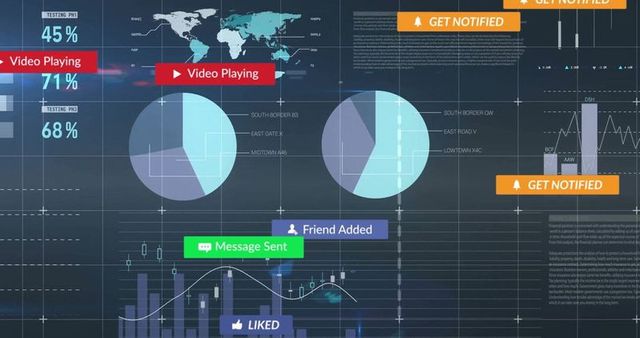
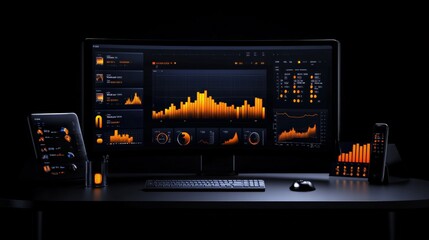
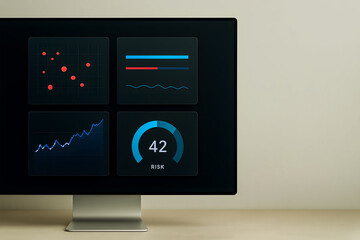
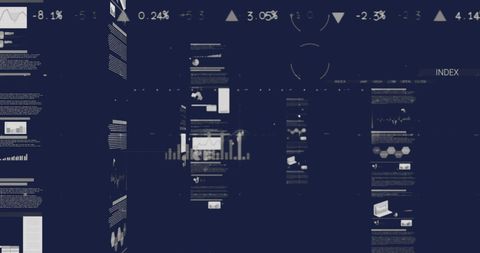
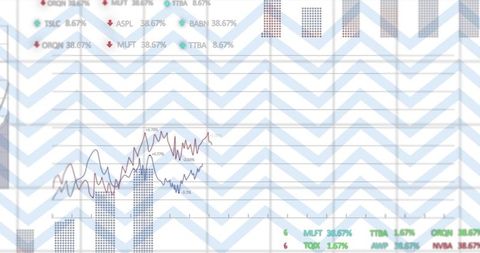
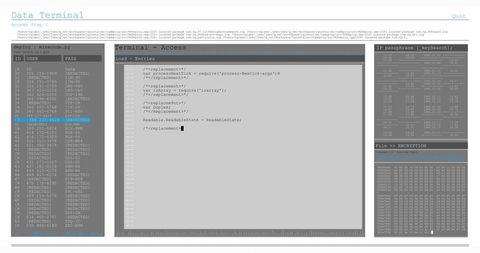
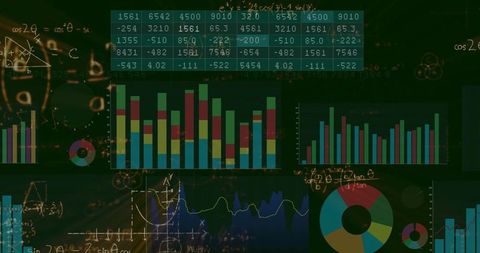
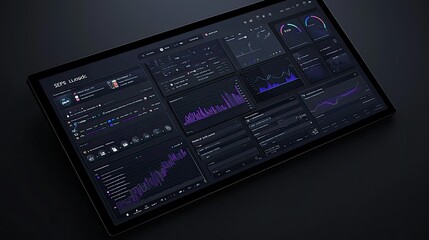
- Dark Mode UI Dashboard with Data Analytics and Visualizations
Dark Mode UI Dashboard with Data Analytics and Visualizations Image
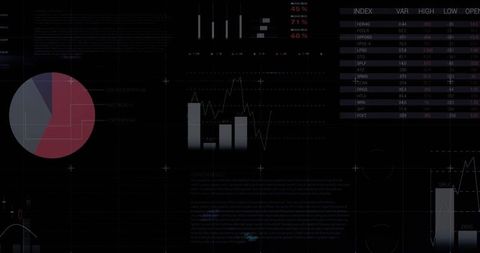
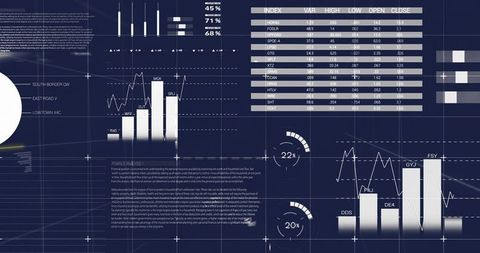
This digital dashboard showcases a sophisticated interface with multiple visualization tools including pie charts, bar and line charts, histograms, and data tables, all rendered on a dark background. Ideal for applications in finance and data analysis, this analytic dashboard effectively communicates complex information in a streamlined and accessible manner. Useful for presentations, modern tech app designing, and enhancing interactive financial reports.
Powered by 


downloads
Tags:
More
Credit Photo
If you would like to credit the Photo, here are some ways you can do so
Text Link
photo Link
<span class="text-link">
<span>
<a target="_blank" href=https://pikwizard.com/photo/dark-mode-ui-dashboard-with-data-analytics-and-visualizations/59f4b8be432266d5562805687c8e0d89/>PikWizard</a>
</span>
</span>
<span class="image-link">
<span
style="margin: 0 0 20px 0; display: inline-block; vertical-align: middle; width: 100%;"
>
<a
target="_blank"
href="https://pikwizard.com/photo/dark-mode-ui-dashboard-with-data-analytics-and-visualizations/59f4b8be432266d5562805687c8e0d89/"
style="text-decoration: none; font-size: 10px; margin: 0;"
>
<img src="https://pikwizard.com/pw/medium/59f4b8be432266d5562805687c8e0d89.jpg" style="margin: 0; width: 100%;" alt="" />
<p style="font-size: 12px; margin: 0;">PikWizard</p>
</a>
</span>
</span>
Free (free of charge)
Free for personal and commercial use.
Author: Awesome Content
Similar Free Stock Images

Premium


Premium

Premium


Premium


Premium


Premium


Premium


Premium


Premium

Premium

Premium


Premium


Premium


Premium

Premium

Premium


Premium


Premium


Premium


Premium


Premium

Premium


Premium


Premium


Premium


Explore More Free Stock Images