
- Home >
- Stock Photos >
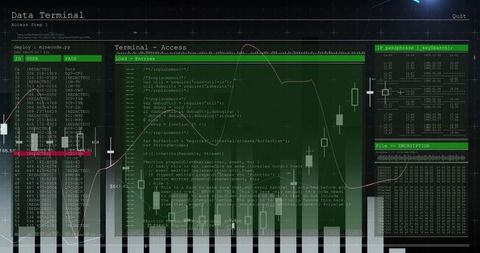
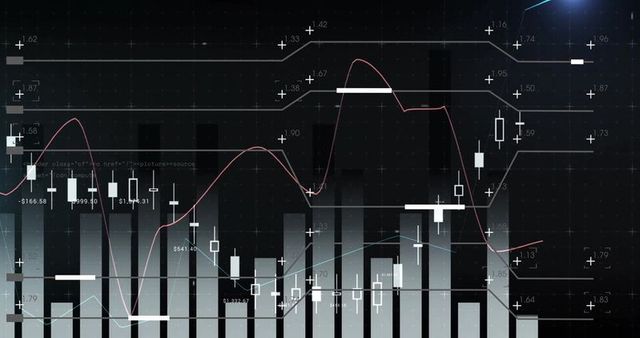
- Dark Neon Analytics Dashboard Showing Six Bars with Line Graph, Code Overlay and Waveform
Dark Neon Analytics Dashboard Showing Six Bars with Line Graph, Code Overlay and Waveform Image

Visual featuring dark analytics dashboard with six vertical bars, white line graph overlay, green glowing code stream, and oscilloscope-style waveform. Numeric labels above bars and subtle gridlines creating technical, data-driven mood. Composition working well for hero banners, blog headers, slide backgrounds, report covers, dashboard mockups, and marketing materials for analytics or cybersecurity products. Design suggestions including leaving left or right margin for headline text, cropping to 16:9 or 4:5 for social use, desaturating neon green for subtler branding, and increasing contrast for print. Color palette emphasizing dark charcoal, neon green, white, cool gray. Licensing ideas including use for analytics platform landing pages, SaaS product marketing, data science tutorials, financial performance reports, and telemetry dashboard visuals.
Powered by  - Get 15% off with code: PIKWIZARD15


downloads
Tags:
More
Credit Photo
If you would like to credit the Photo, here are some ways you can do so
Text Link
photo Link
<span class="text-link">
<span>
<a target="_blank" href=https://pikwizard.com/photo/dark-neon-analytics-dashboard-showing-six-bars-with-line-graph-code-overlay-and-waveform/f5bede2155ca48c1408ec972bfdd749f/>PikWizard</a>
</span>
</span>
<span class="image-link">
<span
style="margin: 0 0 20px 0; display: inline-block; vertical-align: middle; width: 100%;"
>
<a
target="_blank"
href="https://pikwizard.com/photo/dark-neon-analytics-dashboard-showing-six-bars-with-line-graph-code-overlay-and-waveform/f5bede2155ca48c1408ec972bfdd749f/"
style="text-decoration: none; font-size: 10px; margin: 0;"
>
<img src="https://pikwizard.com/pw/medium/f5bede2155ca48c1408ec972bfdd749f.jpg" style="margin: 0; width: 100%;" alt="" />
<p style="font-size: 12px; margin: 0;">PikWizard</p>
</a>
</span>
</span>
Free (free of charge)
Free for personal and commercial use.
Author: Authentic Images
Similar Free Stock Images

Premium


Premium

Premium


Premium


Premium


Premium


Premium


Premium

Premium

Premium

Premium


Premium


Premium


Premium


Premium


Premium


Premium


Premium


Premium


Premium


Premium

Premium


Premium


Premium


Premium


Explore More Free Stock Images