
- Home >
- Stock Photos >
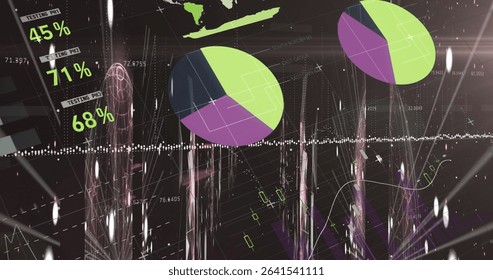
- Dark Themed Data Analytics Dashboard Interface
Dark Themed Data Analytics Dashboard Interface Image
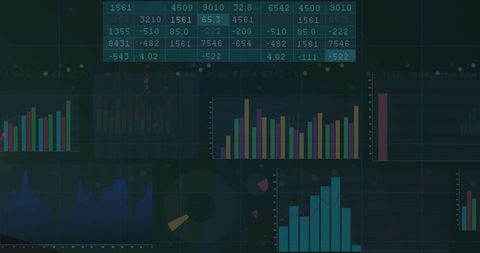
Dark backdrop enhances vibrant data elements, providing clarity and contrast. Ideal for technology-oriented presentations, highlighting each graphical element for engaged viewer experience. Use it to design professional presentations showcasing complex data intuitively.
Powered by  - Get 15% off with code: PIKWIZARD15


downloads
Tags:
More
Credit Photo
If you would like to credit the Photo, here are some ways you can do so
Text Link
photo Link
<span class="text-link">
<span>
<a target="_blank" href=https://pikwizard.com/photo/dark-themed-data-analytics-dashboard-interface/4a35f1aa718815c76fd38cf1342ecc82/>PikWizard</a>
</span>
</span>
<span class="image-link">
<span
style="margin: 0 0 20px 0; display: inline-block; vertical-align: middle; width: 100%;"
>
<a
target="_blank"
href="https://pikwizard.com/photo/dark-themed-data-analytics-dashboard-interface/4a35f1aa718815c76fd38cf1342ecc82/"
style="text-decoration: none; font-size: 10px; margin: 0;"
>
<img src="https://pikwizard.com/pw/medium/4a35f1aa718815c76fd38cf1342ecc82.jpg" style="margin: 0; width: 100%;" alt="" />
<p style="font-size: 12px; margin: 0;">PikWizard</p>
</a>
</span>
</span>
Free (free of charge)
Free for personal and commercial use.
Author: Creative Art
Similar Free Stock Images

Premium


Premium

Premium


Premium


Premium


Premium


Premium

Premium

Premium

Premium


Premium


Premium


Premium


Premium


Premium


Premium


Premium


Premium


Premium


Premium

Premium


Premium


Premium


Premium

Premium


Explore More Free Stock Images