
- Home >
- Stock Photos >
- Dark-Themed Financial Dashboard with Orange Line Graph
Dark-Themed Financial Dashboard with Orange Line Graph Image
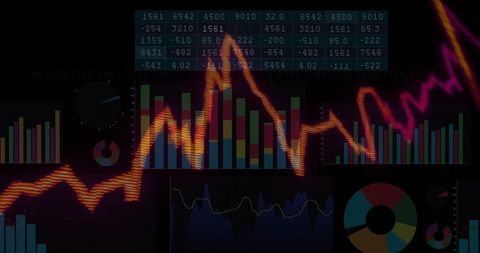
Professional-looking visualization displaying corporate financial data with focus on an orange line graph. Useful for seminars on modern financial analytics, business intelligence software presentations, and digital strategy meetings to highlight advanced data dashboard design.
Powered by  - Get 15% off with code: PIKWIZARD15


0
downloads
downloads
Tags:
More
Credit Photo
If you would like to credit the Photo, here are some ways you can do so
Text Link
photo Link
<span class="text-link">
<span>
<a target="_blank" href=https://pikwizard.com/photo/dark-themed-financial-dashboard-with-orange-line-graph/a6fbc0ebddc700ac42f758dcd52f145e/>PikWizard</a>
</span>
</span>
<span class="image-link">
<span
style="margin: 0 0 20px 0; display: inline-block; vertical-align: middle; width: 100%;"
>
<a
target="_blank"
href="https://pikwizard.com/photo/dark-themed-financial-dashboard-with-orange-line-graph/a6fbc0ebddc700ac42f758dcd52f145e/"
style="text-decoration: none; font-size: 10px; margin: 0;"
>
<img src="https://pikwizard.com/pw/medium/a6fbc0ebddc700ac42f758dcd52f145e.jpg" style="margin: 0; width: 100%;" alt="" />
<p style="font-size: 12px; margin: 0;">PikWizard</p>
</a>
</span>
</span>
Free (free of charge)
Free for personal and commercial use.
Author: Awesome Content