
- Home >
- Stock Photos >
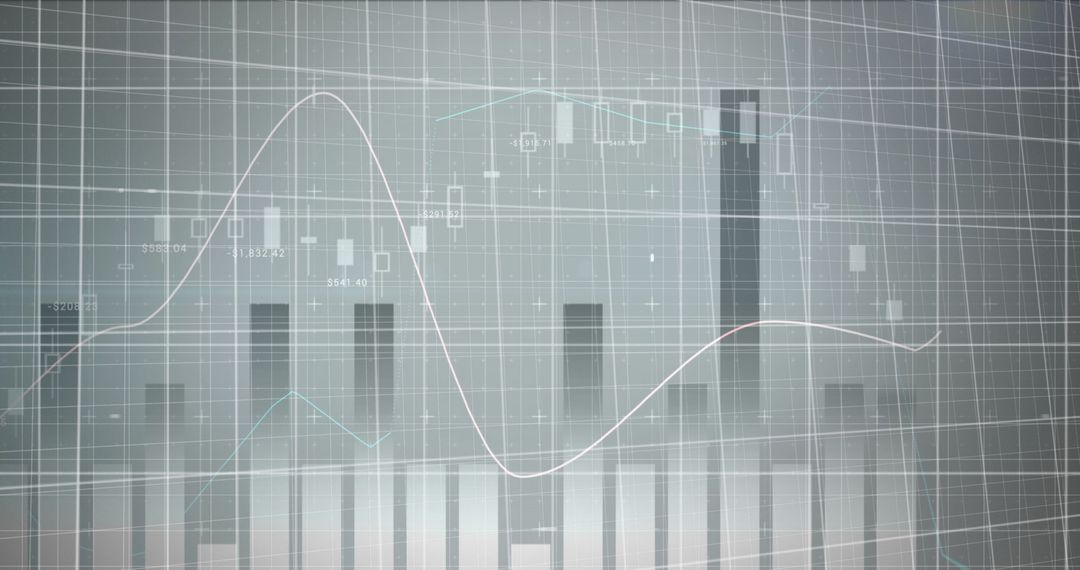
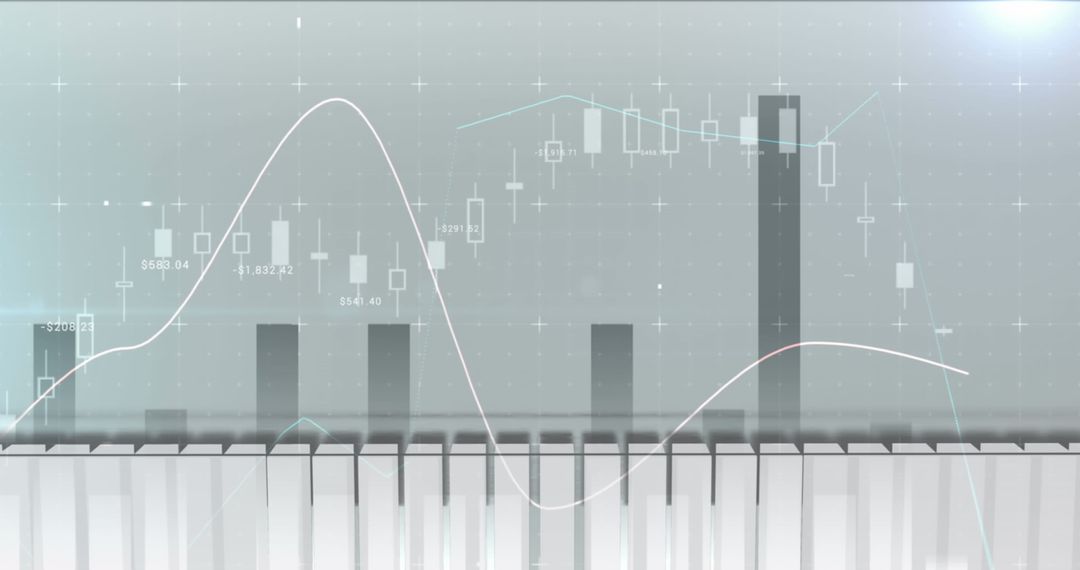
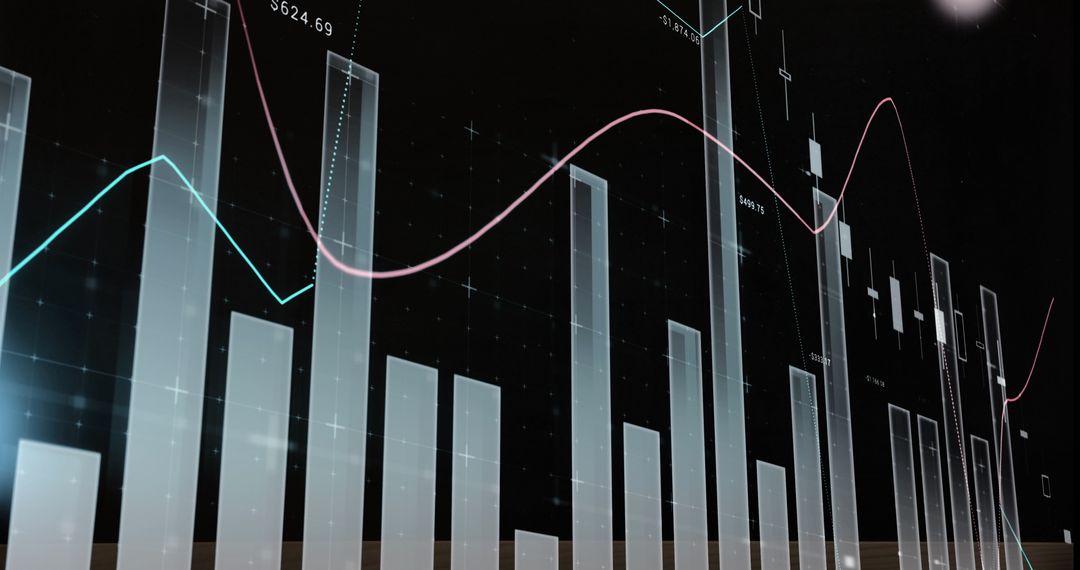
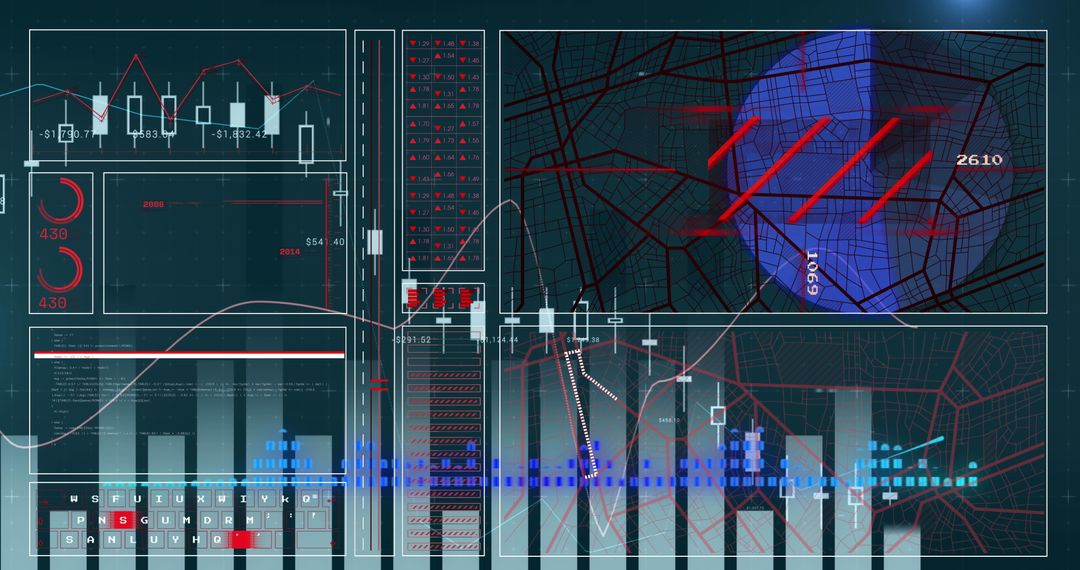
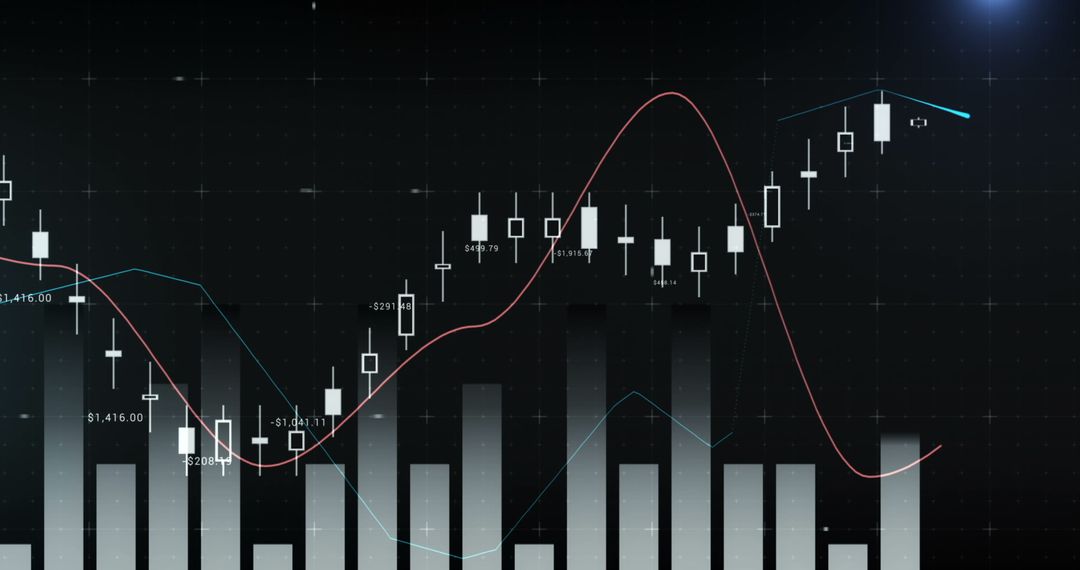
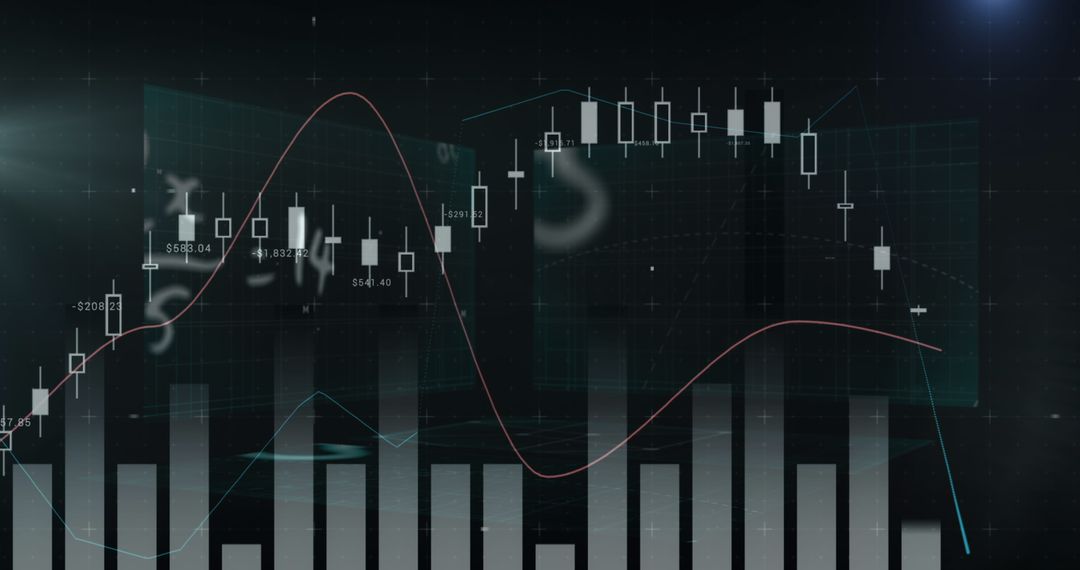
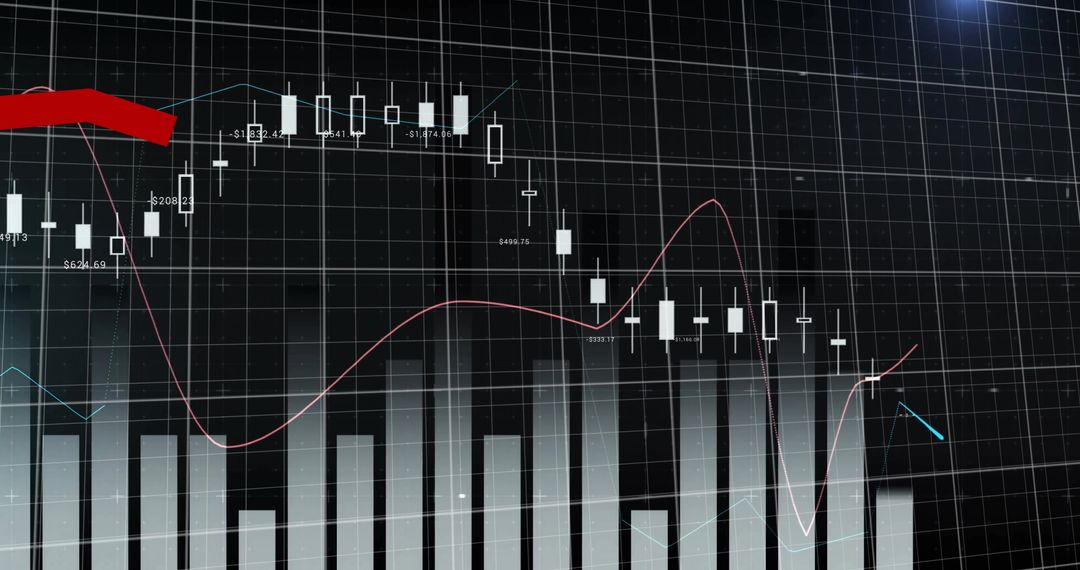
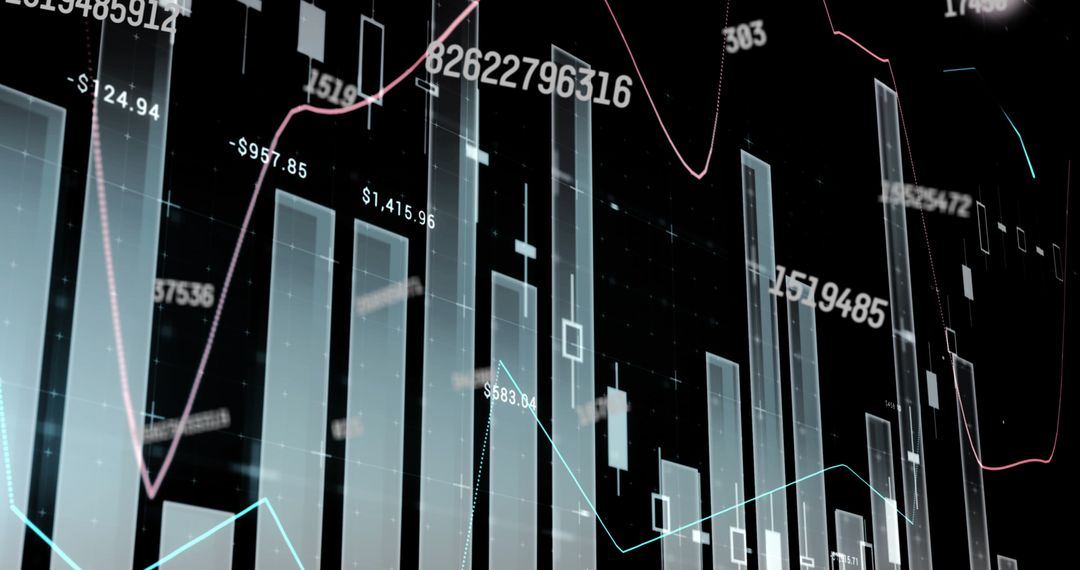
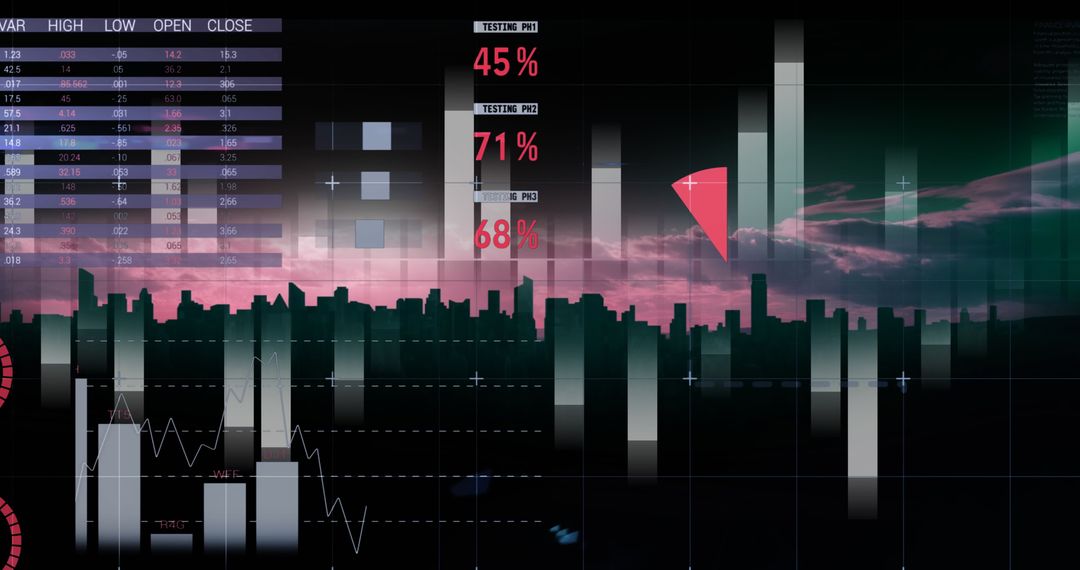
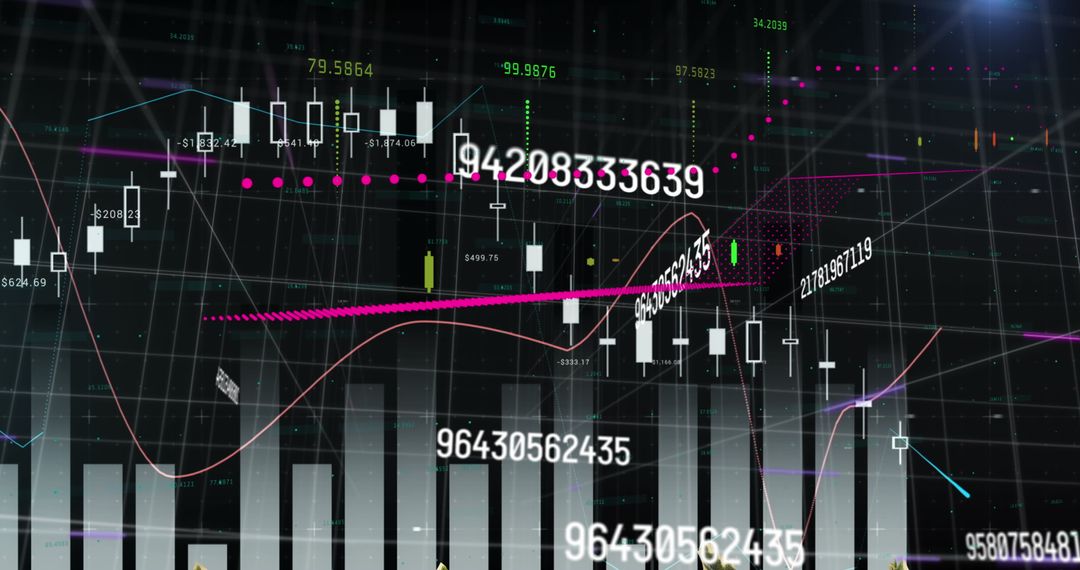
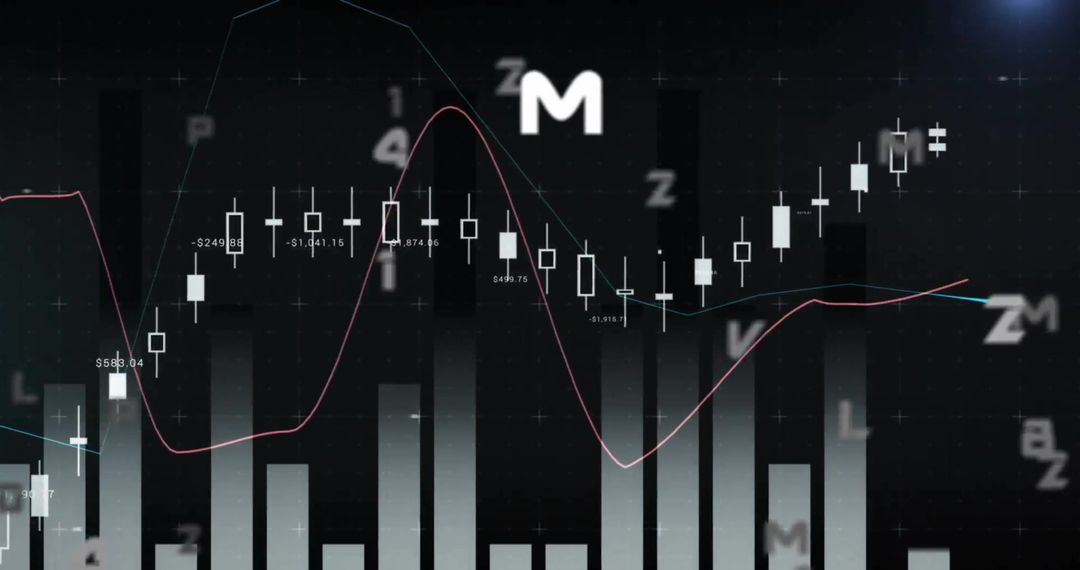
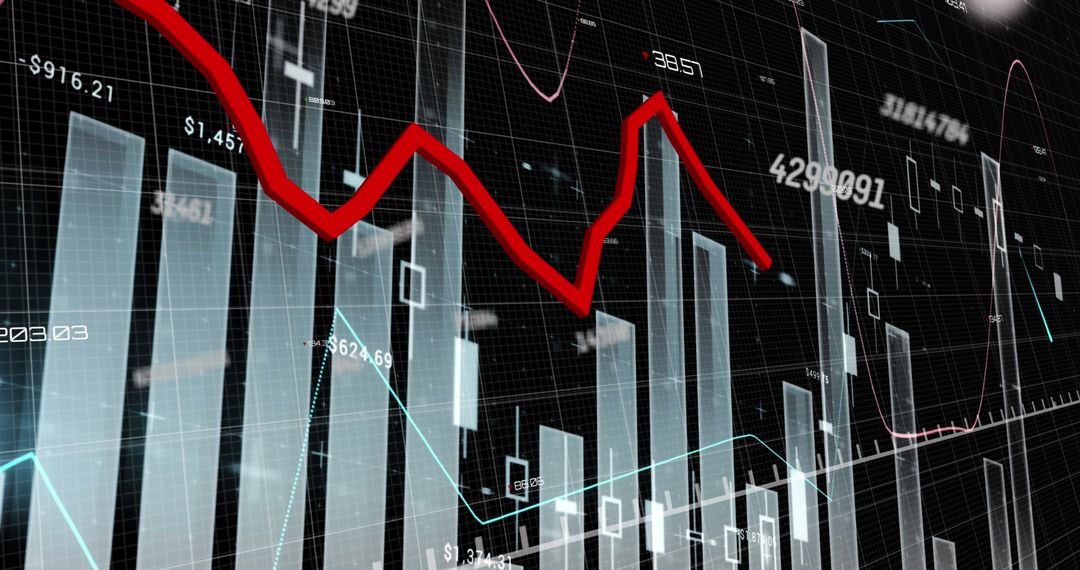
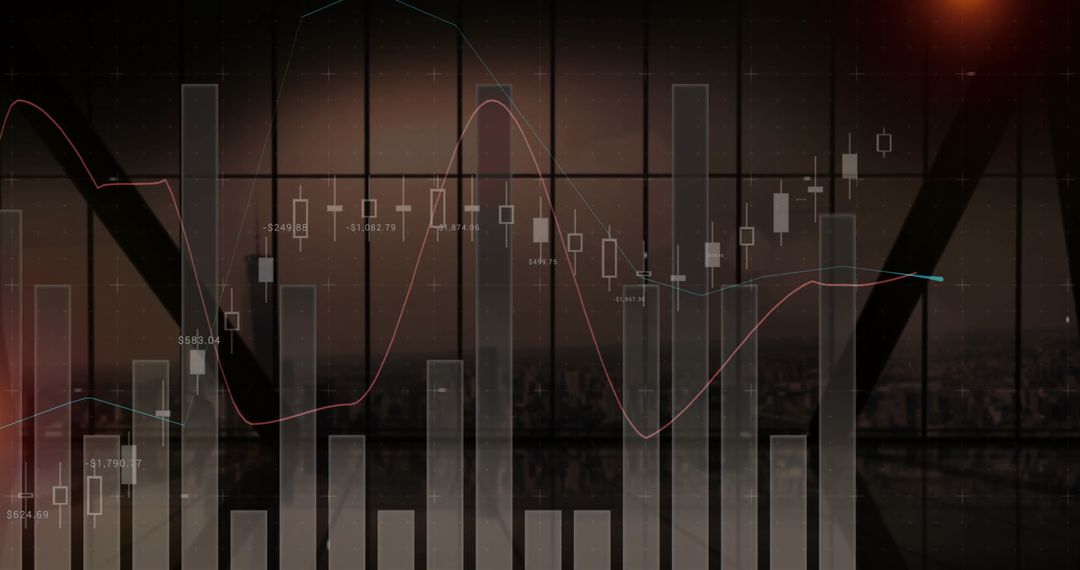
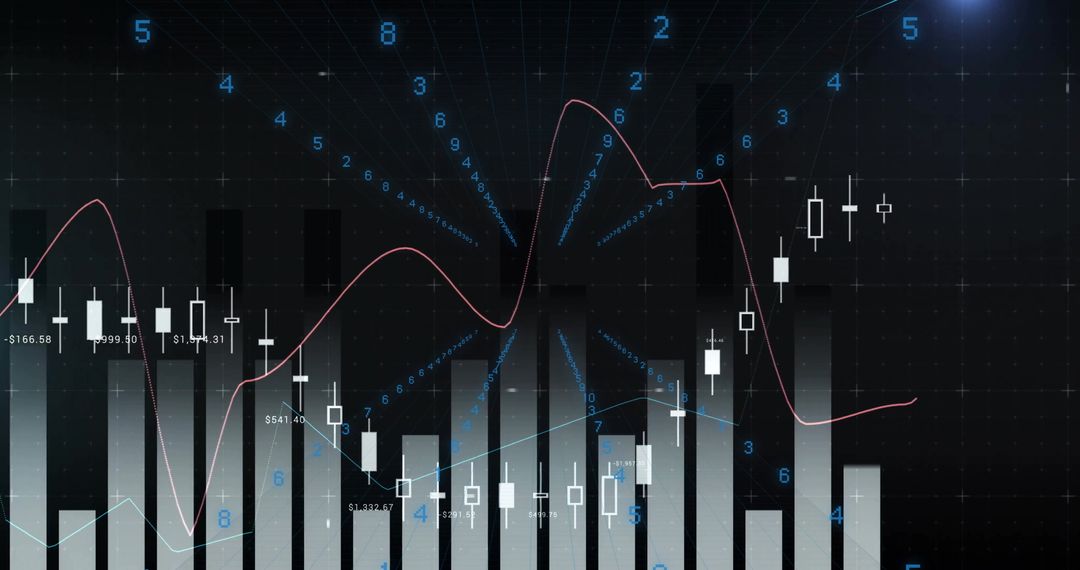
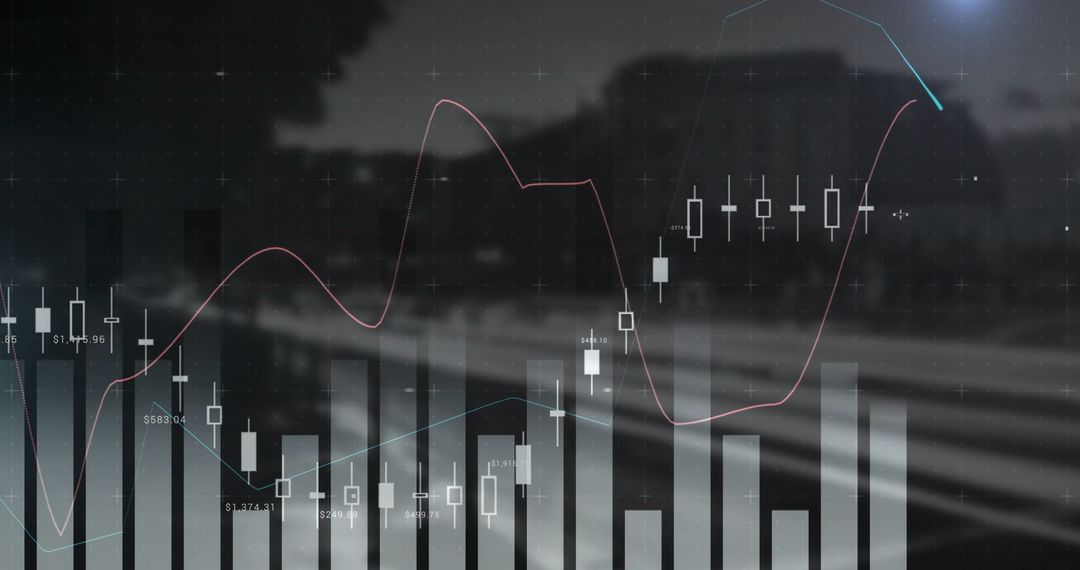
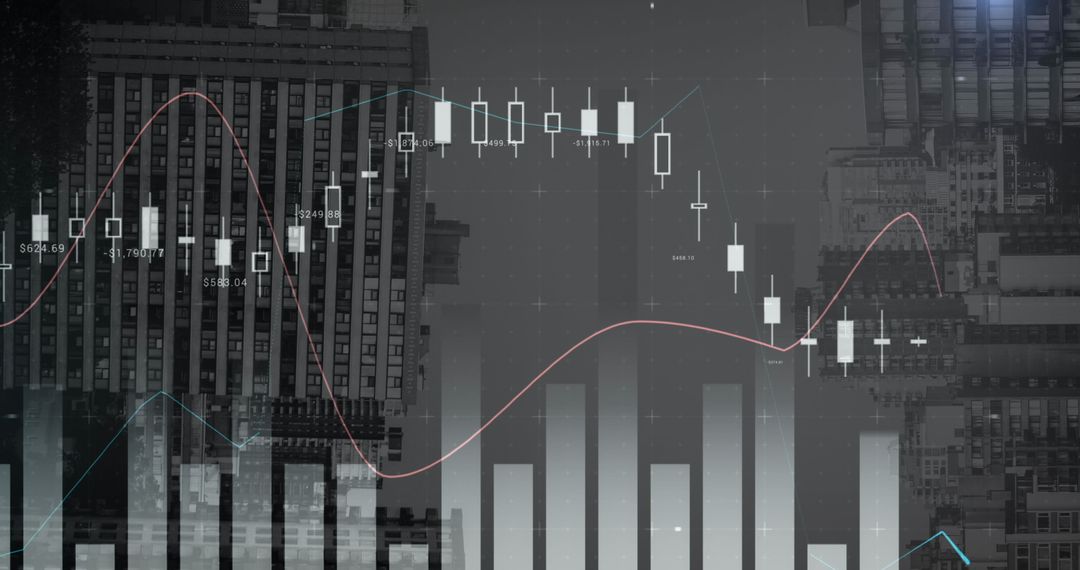
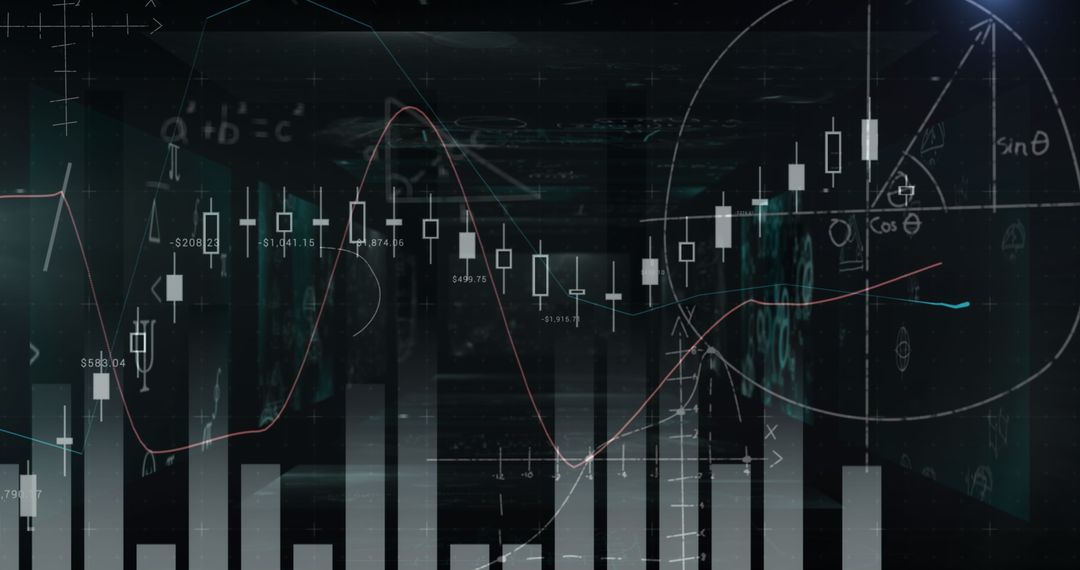
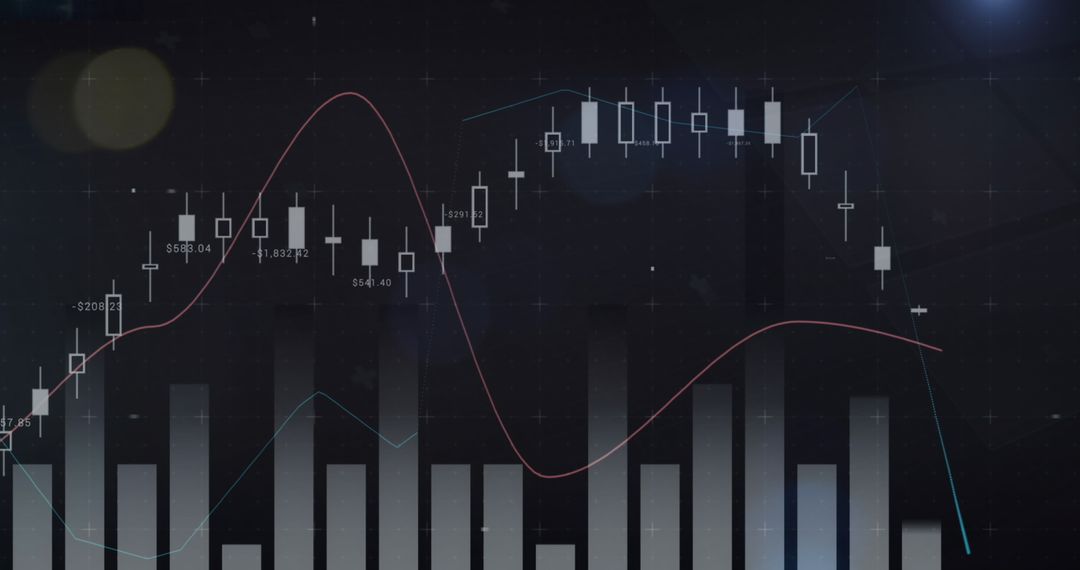
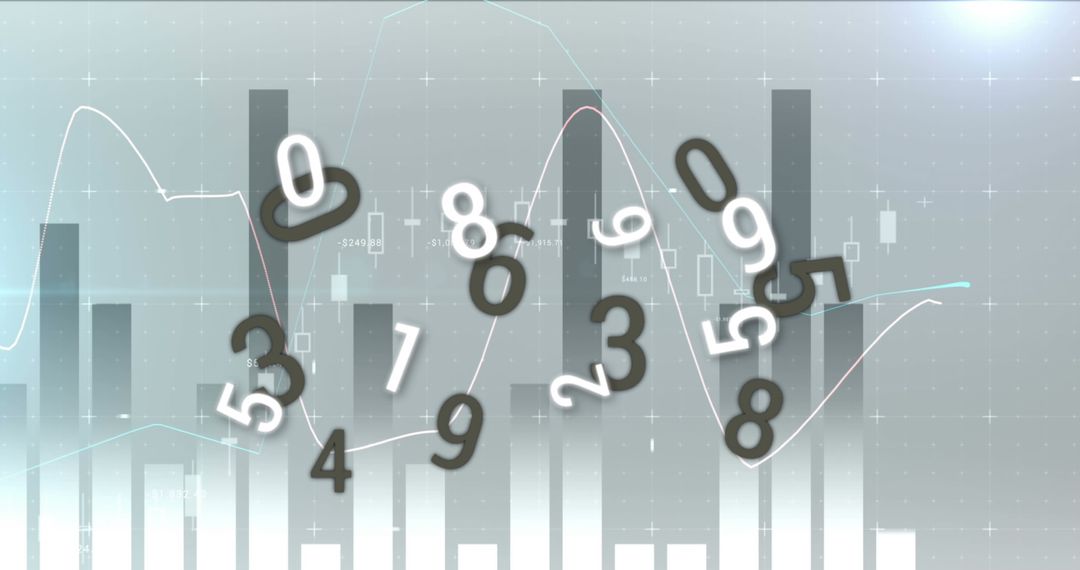
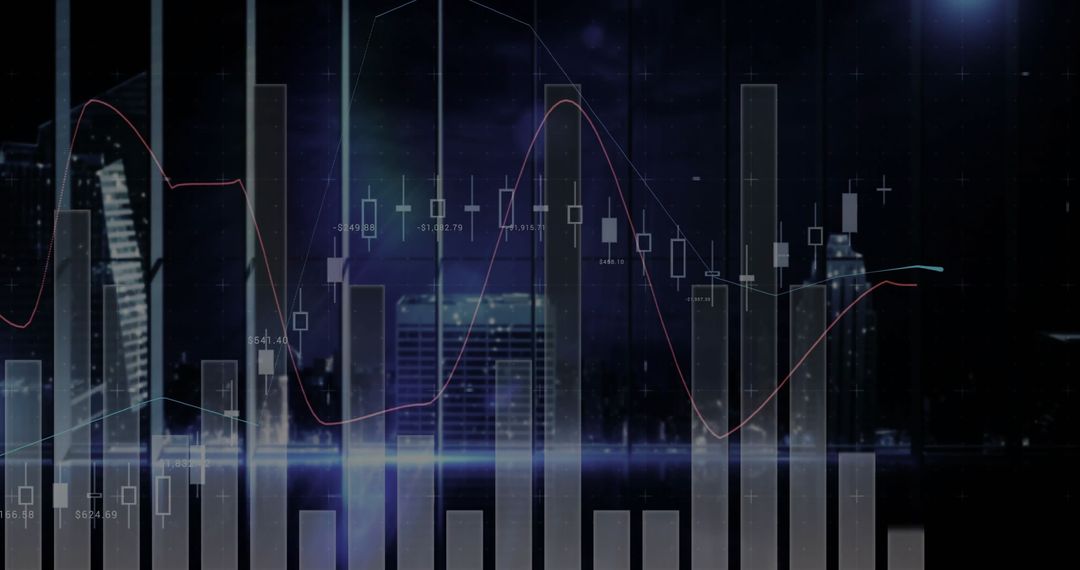
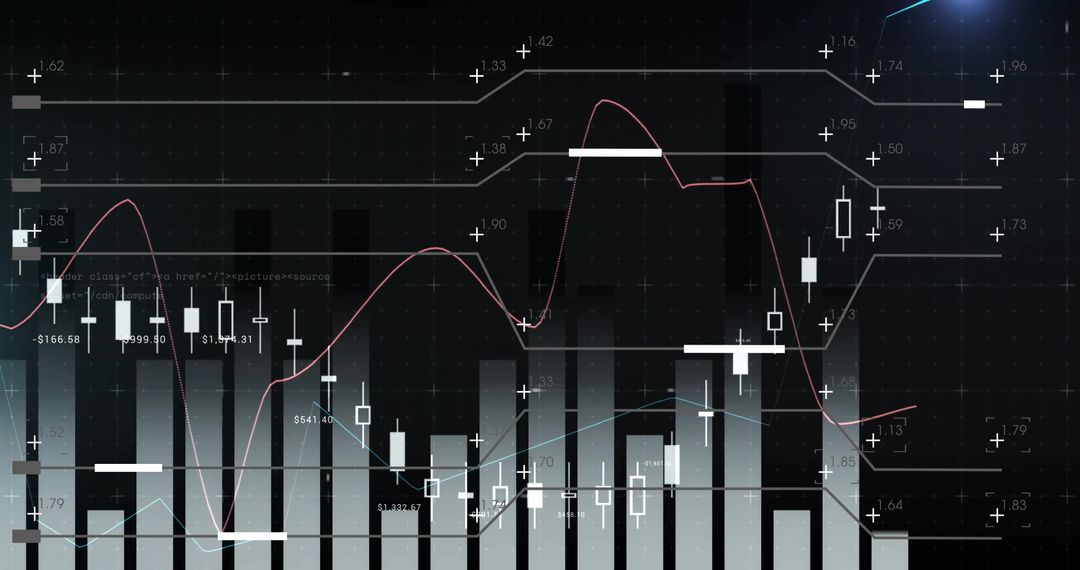
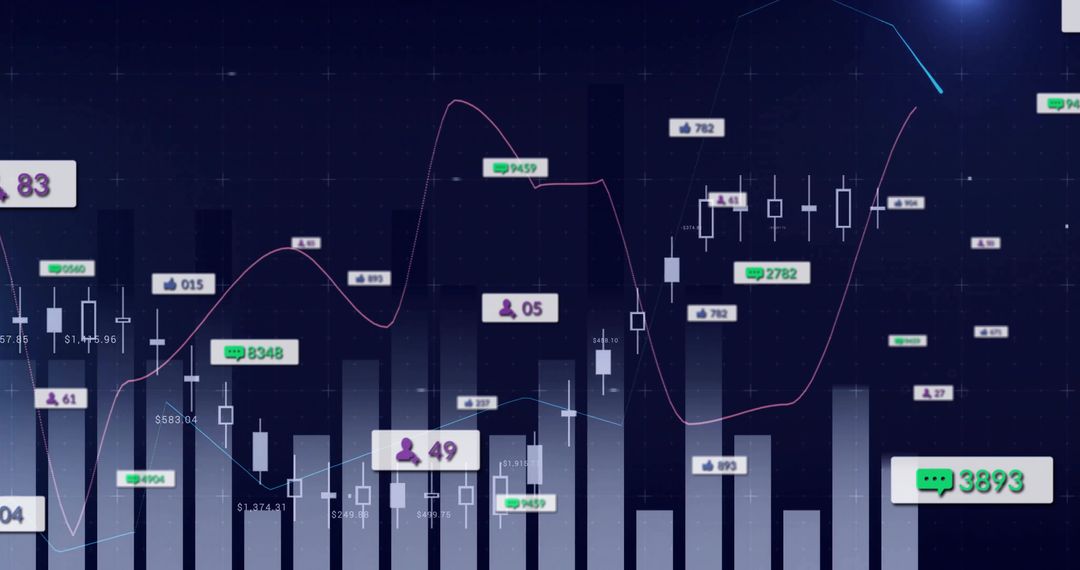
- Dark Trading Dashboard Showing Candlestick Chart, Volume Histogram, Moving Averages and Indicators
Dark Trading Dashboard Showing Candlestick Chart, Volume Histogram, Moving Averages and Indicators Image

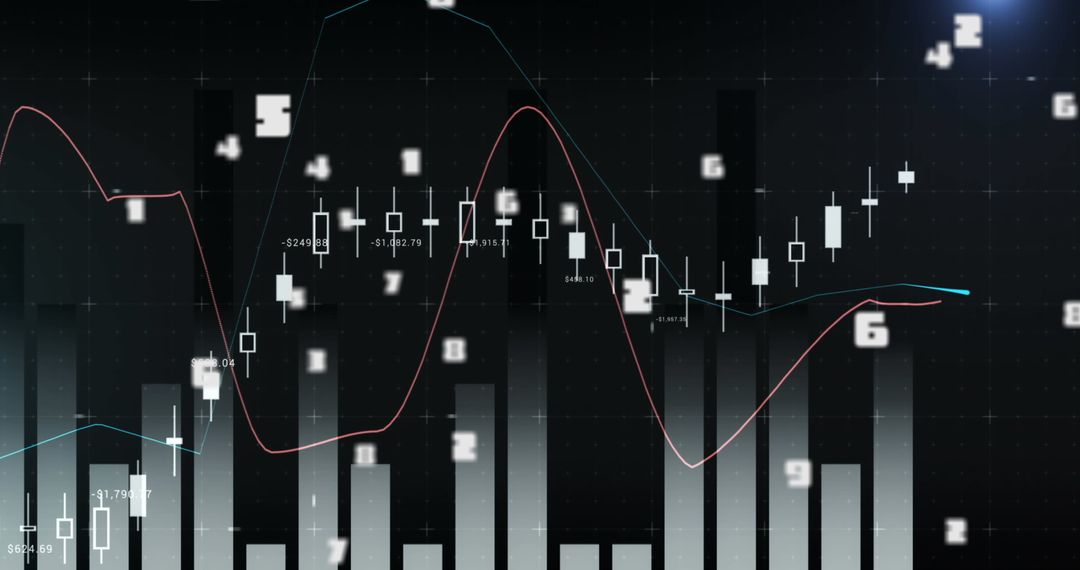
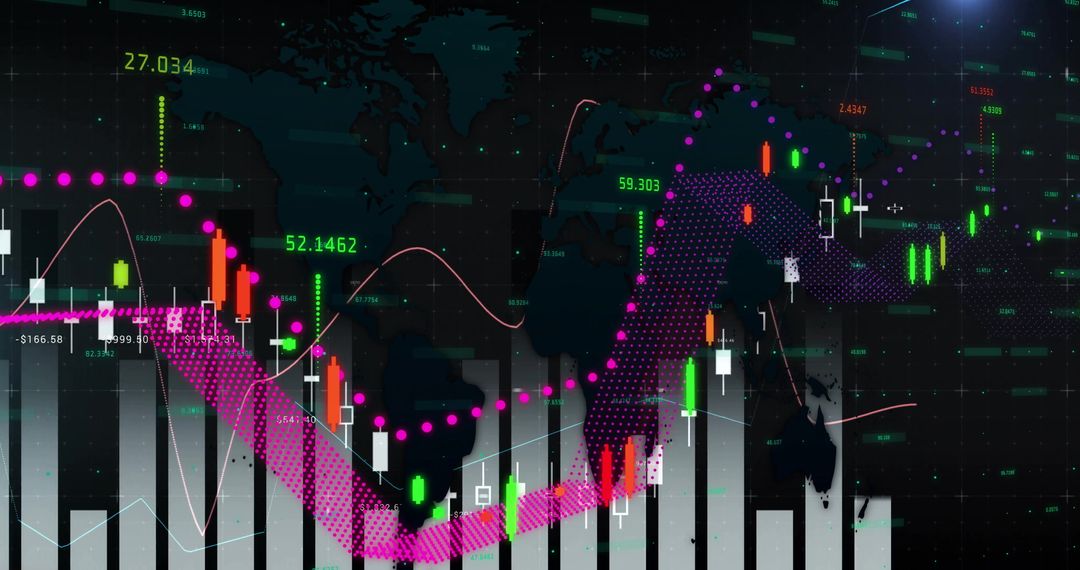
Showing dark trading interface with white candlesticks, translucent volume bars rising from bottom, red and blue moving average lines and subtle trendline curves. Featuring numeric labels, badge-style annotations and grid background for high-tech, data-driven look. Perfect for illustrating market volatility, explaining candlestick patterns, promoting trading tools, visualizing analytics dashboards and supporting investor communications. Suitable for fintech website headers, trading platform demos, financial blog banners, market research reports, educational slides, social media campaigns and pitch decks. Providing space for overlaying logos, headlines and call-to-action elements while delivering modern, high-contrast visuals for both web and print.
Powered by 


0
downloads
downloads
Tags:
More
Credit Photo
If you would like to credit the Photo, here are some ways you can do so
Text Link
photo Link
<span class="text-link">
<span>
<a target="_blank" href=https://pikwizard.com/photo/dark-trading-dashboard-showing-candlestick-chart-volume-histogram-moving-averages-and-indicators/8c39e84e6d860ac2b42fbd2dfb26afaa/>PikWizard</a>
</span>
</span>
<span class="image-link">
<span
style="margin: 0 0 20px 0; display: inline-block; vertical-align: middle; width: 100%;"
>
<a
target="_blank"
href="https://pikwizard.com/photo/dark-trading-dashboard-showing-candlestick-chart-volume-histogram-moving-averages-and-indicators/8c39e84e6d860ac2b42fbd2dfb26afaa/"
style="text-decoration: none; font-size: 10px; margin: 0;"
>
<img src="https://pikwizard.com/pw/medium/8c39e84e6d860ac2b42fbd2dfb26afaa.jpg" style="margin: 0; width: 100%;" alt="" />
<p style="font-size: 12px; margin: 0;">PikWizard</p>
</a>
</span>
</span>
Free (free of charge)
Free for personal and commercial use.
Author: Creative Art
Similar Free Stock Images
Premium


Premium


Premium


Premium


Premium


Premium


Premium

Premium


Premium


Premium


Premium


Premium


Premium


Premium


Premium


Premium


Premium


Premium


Premium


Premium


Premium


Premium


Premium


Premium

