
- Home >
- Stock Photos >
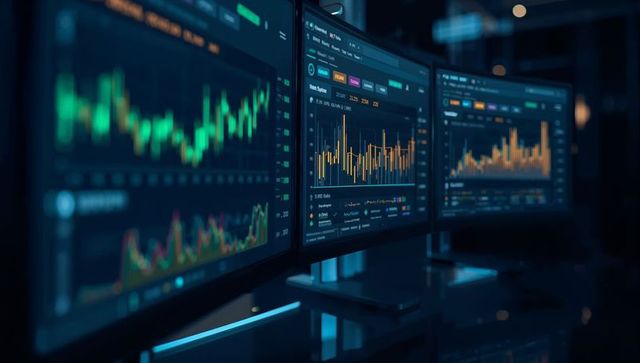
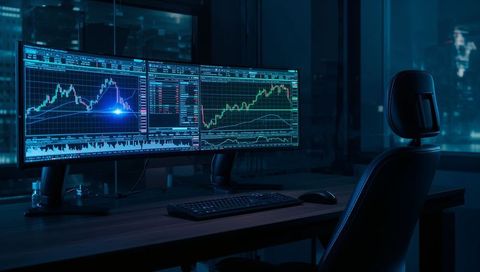
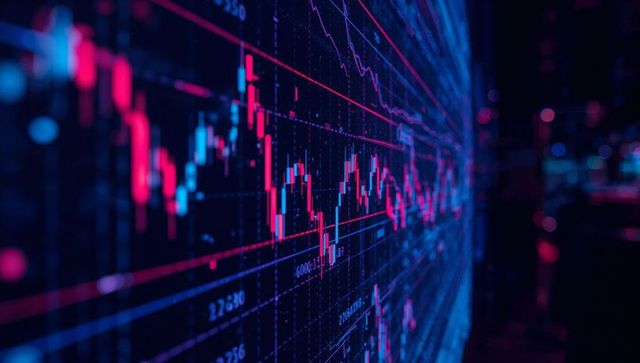
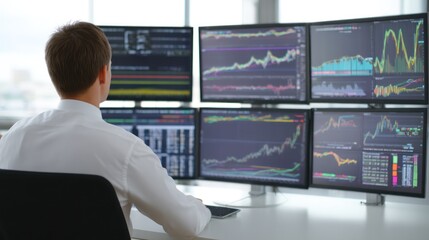
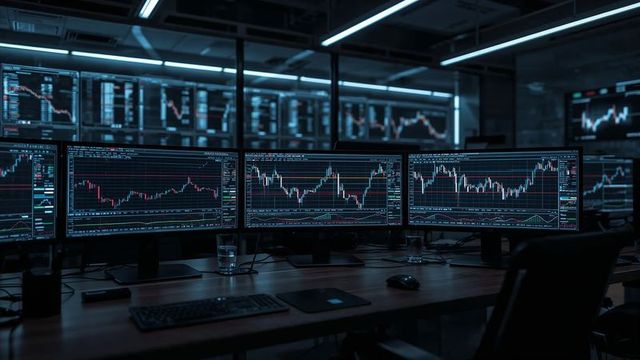
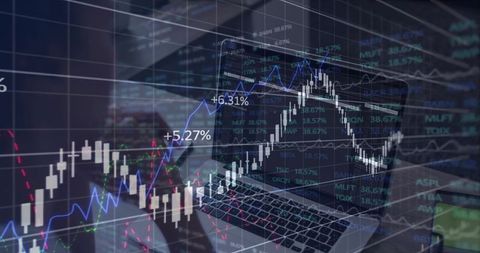
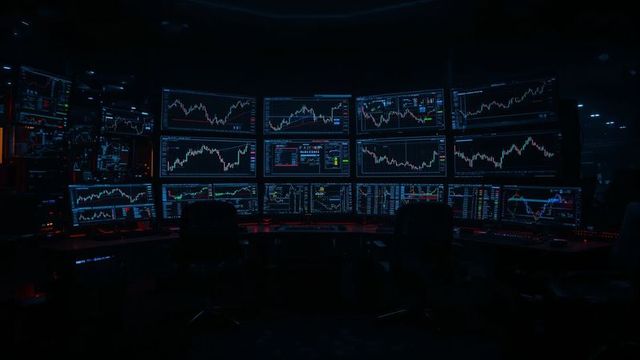
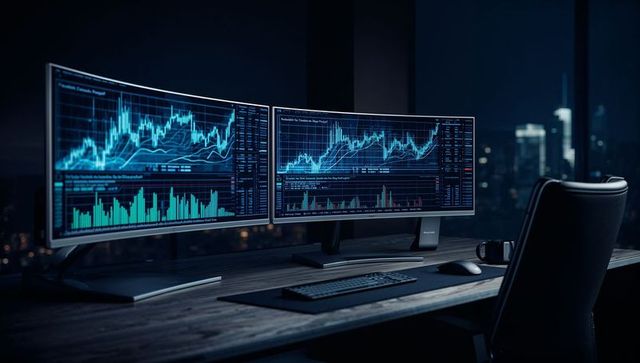
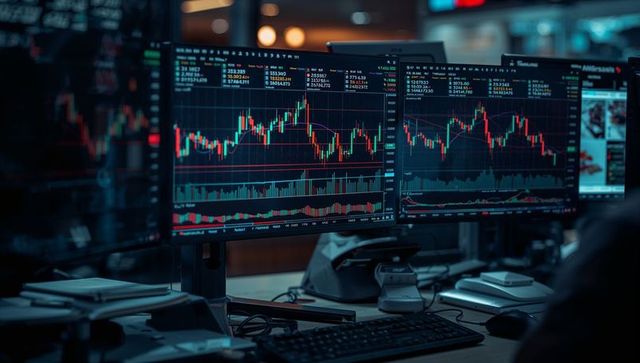
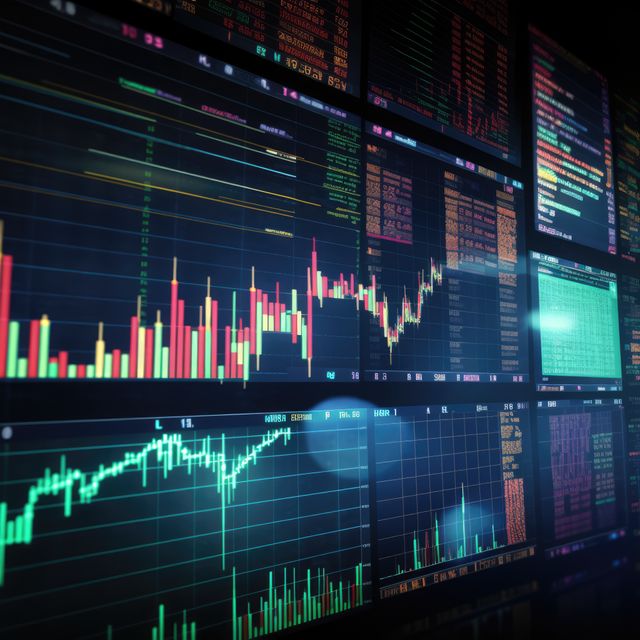
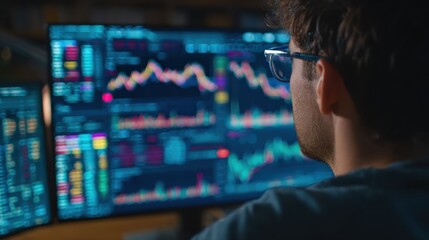
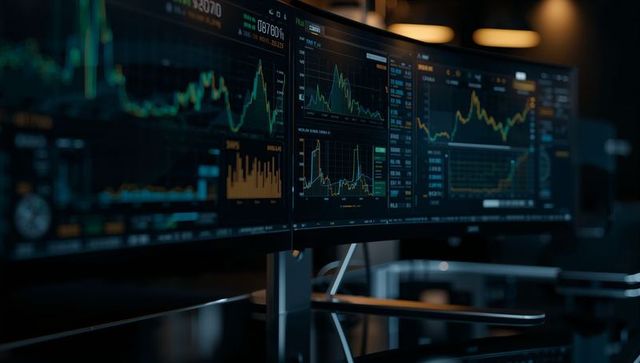
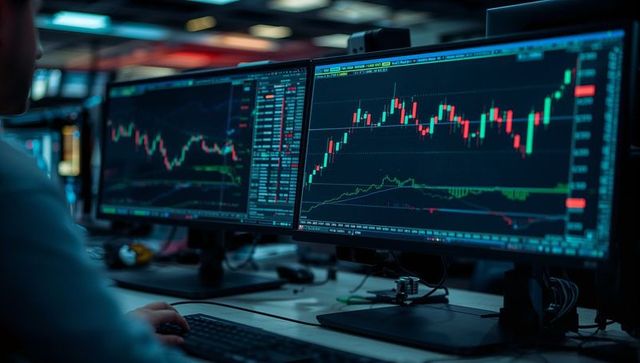
- Dark Trading Workstation with Candlestick Charts Display
Dark Trading Workstation with Candlestick Charts Display Image
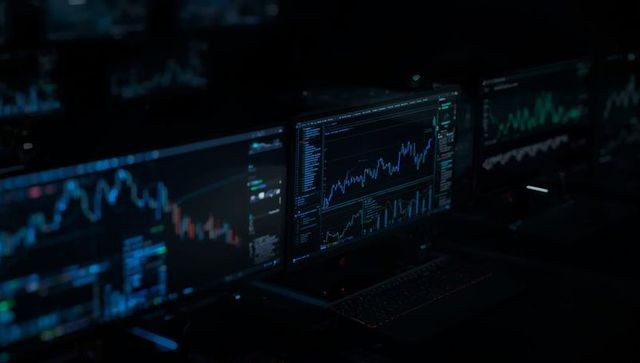
AI Generated Image. Visual featuring an array of monitors in a dimly lit workspace displaying financial candlestick and line charts. Scene captures essence of modern finance technology and digital trading. Perfect for use in articles about stock trading, data analysis, financial technology, and investment strategies.
Powered by 


0
downloads
downloads
Tags:
More
Credit Photo
If you would like to credit the Photo, here are some ways you can do so
Text Link
photo Link
<span class="text-link">
<span>
<a target="_blank" href=https://pikwizard.com/photo/dark-trading-workstation-with-candlestick-charts-display/17fe5b6378870ab00ea70357908c9117/>PikWizard</a>
</span>
</span>
<span class="image-link">
<span
style="margin: 0 0 20px 0; display: inline-block; vertical-align: middle; width: 100%;"
>
<a
target="_blank"
href="https://pikwizard.com/photo/dark-trading-workstation-with-candlestick-charts-display/17fe5b6378870ab00ea70357908c9117/"
style="text-decoration: none; font-size: 10px; margin: 0;"
>
<img src="https://pikwizard.com/pw/medium/17fe5b6378870ab00ea70357908c9117.jpg" style="margin: 0; width: 100%;" alt="" />
<p style="font-size: 12px; margin: 0;">PikWizard</p>
</a>
</span>
</span>
Free (free of charge)
Free for personal and commercial use.
Author: AI Creator
Similar Free Stock Images

Premium


Premium


Premium


Premium

Premium


Premium

Premium


Premium


Premium


Premium


Premium

Premium


Premium


Premium


Premium


Premium


Premium
Premium
Premium


Premium


Premium


Premium


Premium
Premium

Premium

