
- Home >
- Stock Photos >
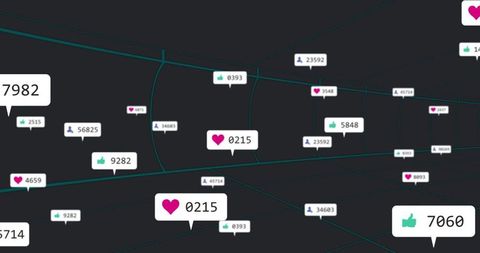
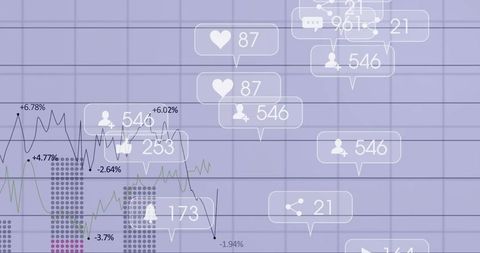
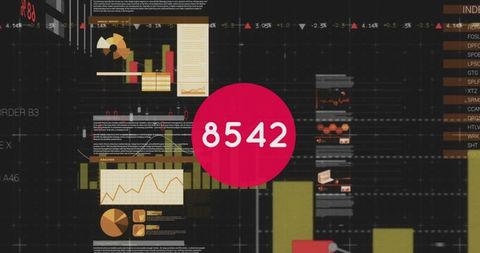
- Dashboard Display with Floating Analytics Bubbles and Red Bars
Dashboard Display with Floating Analytics Bubbles and Red Bars Image
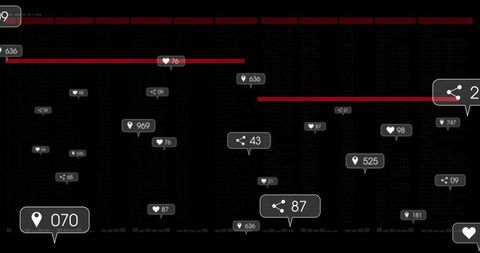
This digital display shows a sleek dashboard with analytics data represented as floating metric bubbles and highlighted red bars against a dark themed background. It is suited for those involved in data analysis and monitoring projects. This type of visualization is perfect for technology and business presentations, instructional materials on data interfaces, or design templates for digital dashboards.
Powered by  - Get 15% off with code: PIKWIZARD15


downloads
Tags:
More
Credit Photo
If you would like to credit the Photo, here are some ways you can do so
Text Link
photo Link
<span class="text-link">
<span>
<a target="_blank" href=https://pikwizard.com/photo/dashboard-display-with-floating-analytics-bubbles-and-red-bars/e6b7752fdb3c031c48b6fcedd7e84ce1/>PikWizard</a>
</span>
</span>
<span class="image-link">
<span
style="margin: 0 0 20px 0; display: inline-block; vertical-align: middle; width: 100%;"
>
<a
target="_blank"
href="https://pikwizard.com/photo/dashboard-display-with-floating-analytics-bubbles-and-red-bars/e6b7752fdb3c031c48b6fcedd7e84ce1/"
style="text-decoration: none; font-size: 10px; margin: 0;"
>
<img src="https://pikwizard.com/pw/medium/e6b7752fdb3c031c48b6fcedd7e84ce1.jpg" style="margin: 0; width: 100%;" alt="" />
<p style="font-size: 12px; margin: 0;">PikWizard</p>
</a>
</span>
</span>
Free (free of charge)
Free for personal and commercial use.
Author: Awesome Content
Similar Free Stock Images

Premium


Premium


Premium


Premium


Premium


Premium


Premium


Premium


Premium

Premium

Premium


Premium


Premium


Premium

Premium


Premium


Premium


Premium


Premium


Premium


Premium


Premium


Premium


Premium


Premium

Explore More Free Stock Images