- Home >
- Stock Photos >
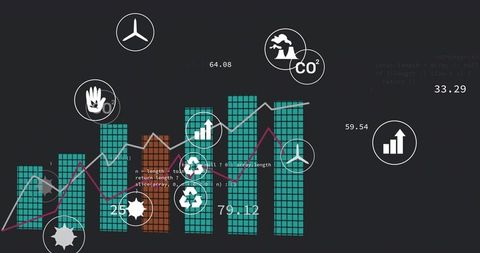
- Dashboard Displaying Global Data Insights with Icons and Graphs
Dashboard Displaying Global Data Insights with Icons and Graphs Image

This illustration spotlighting a futuristic dashboard features a global map with interconnected line graphs, numerical data, and various thematic icons representing technology and sustainability. Ideal for use in presentations about corporate innovations, data analytics tutorials, libraries pertaining to AI development, or articles exploring global sustainability trends. The high-tech visual elements make it suitable for corporate reports focusing on KPI tracking and strategic planning.
Powered by 


0
downloads
downloads
Tags:
More
Credit Photo
If you would like to credit the Photo, here are some ways you can do so
Text Link
photo Link
<span class="text-link">
<span>
<a target="_blank" href=https://pikwizard.com/photo/dashboard-displaying-global-data-insights-with-icons-and-graphs/012c70ce367459b878fec609f9619a53/>PikWizard</a>
</span>
</span>
<span class="image-link">
<span
style="margin: 0 0 20px 0; display: inline-block; vertical-align: middle; width: 100%;"
>
<a
target="_blank"
href="https://pikwizard.com/photo/dashboard-displaying-global-data-insights-with-icons-and-graphs/012c70ce367459b878fec609f9619a53/"
style="text-decoration: none; font-size: 10px; margin: 0;"
>
<img src="https://pikwizard.com/pw/medium/012c70ce367459b878fec609f9619a53.jpg" style="margin: 0; width: 100%;" alt="" />
<p style="font-size: 12px; margin: 0;">PikWizard</p>
</a>
</span>
</span>
Free (free of charge)
Free for personal and commercial use.
Author: Authentic Images
Similar Free Stock Images
Loading...

Premium


Premium


Premium


Premium


Premium


Premium

Premium

Premium


Premium

Premium


Premium


Premium


Premium

Premium


Premium


Premium


Premium


Premium

Premium


Premium


Premium


Premium


Premium

Premium


Premium