
- Home >
- Stock Photos >
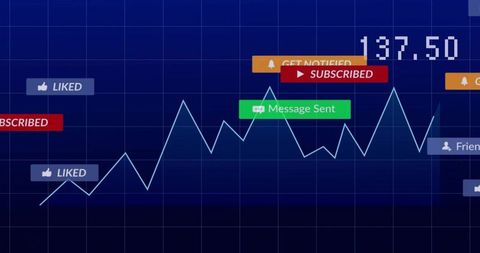
- Dashboard with Data Graph and Alerts for Analytics Insights
Dashboard with Data Graph and Alerts for Analytics Insights Image

Perfect for illustrating data insights or analytics blog posts. Useful in presentations about finance or technology. Highlights the dynamic nature of real-time data in modern interfaces.
Powered by 


downloads
Tags:
More
Credit Photo
If you would like to credit the Photo, here are some ways you can do so
Text Link
photo Link
<span class="text-link">
<span>
<a target="_blank" href=https://pikwizard.com/photo/dashboard-with-data-graph-and-alerts-for-analytics-insights/7c1ac968669a8ea337f39b70d209b9af/>PikWizard</a>
</span>
</span>
<span class="image-link">
<span
style="margin: 0 0 20px 0; display: inline-block; vertical-align: middle; width: 100%;"
>
<a
target="_blank"
href="https://pikwizard.com/photo/dashboard-with-data-graph-and-alerts-for-analytics-insights/7c1ac968669a8ea337f39b70d209b9af/"
style="text-decoration: none; font-size: 10px; margin: 0;"
>
<img src="https://pikwizard.com/pw/medium/7c1ac968669a8ea337f39b70d209b9af.jpg" style="margin: 0; width: 100%;" alt="" />
<p style="font-size: 12px; margin: 0;">PikWizard</p>
</a>
</span>
</span>
Free (free of charge)
Free for personal and commercial use.
Author: People Creations
Similar Free Stock Images

Premium


Premium


Premium


Premium


Premium

Premium


Premium


Premium


Premium


Premium

Premium


Premium


Premium

Premium

Premium


Premium

Premium


Premium


Premium


Premium


Premium

Premium


Premium


Premium


Premium

Explore More Free Stock Images