- Home >
- Stock Photos >
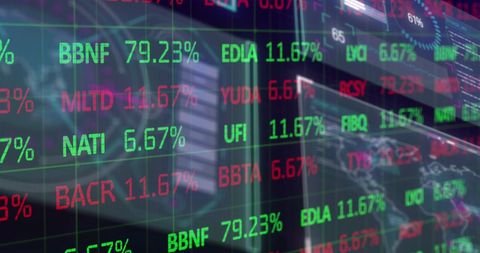
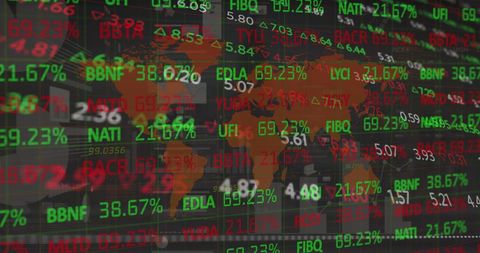
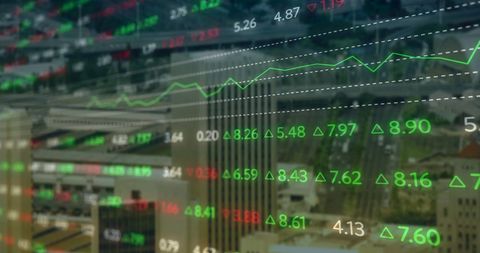
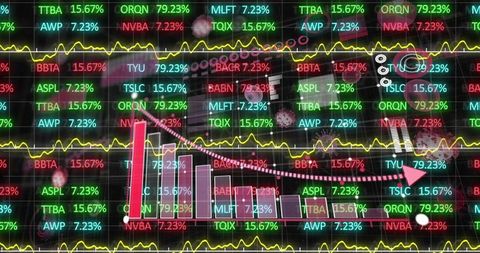
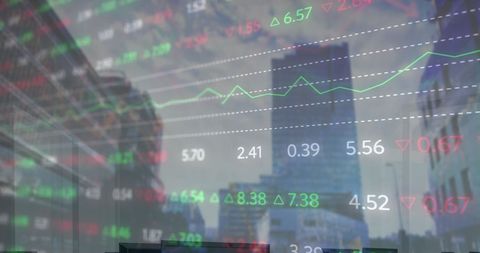
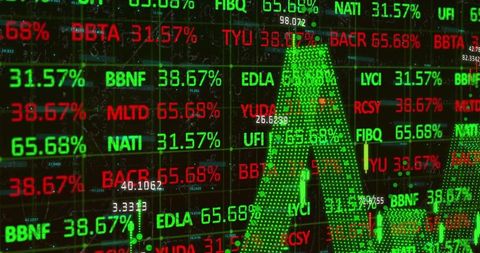
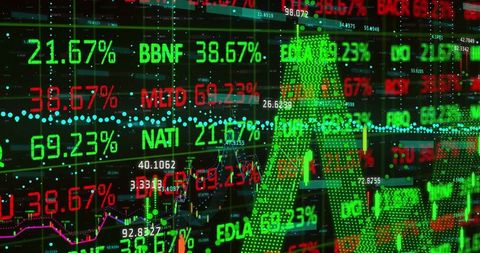
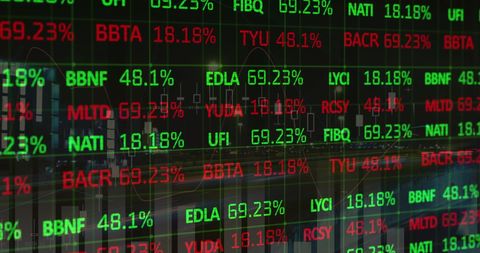
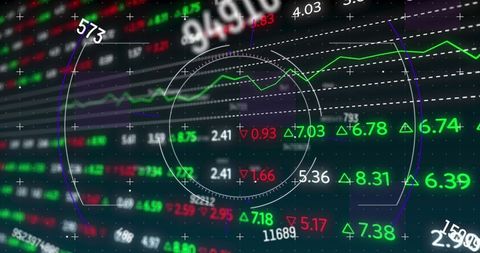
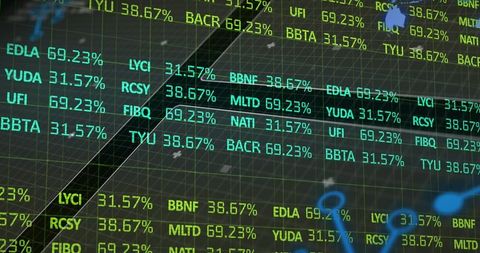
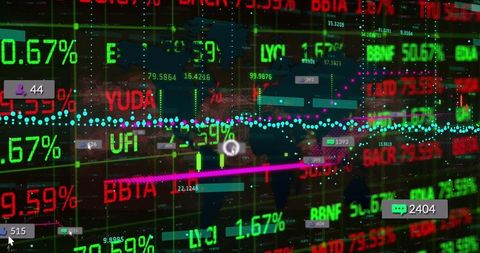
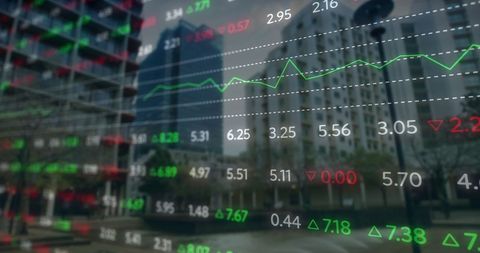
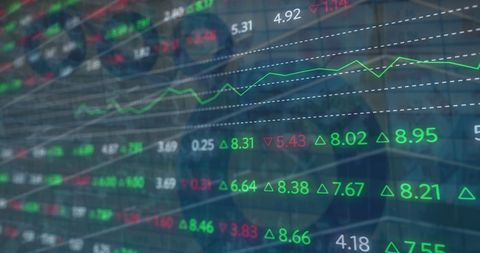
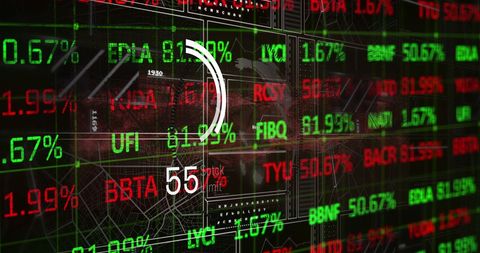
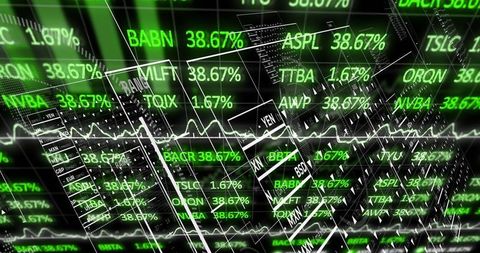
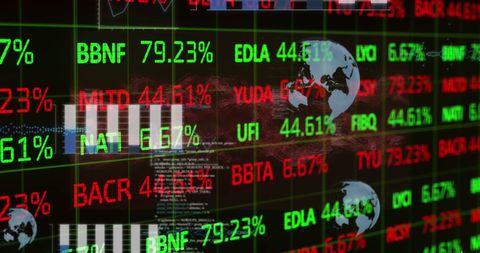
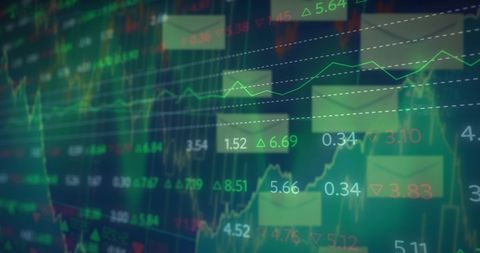
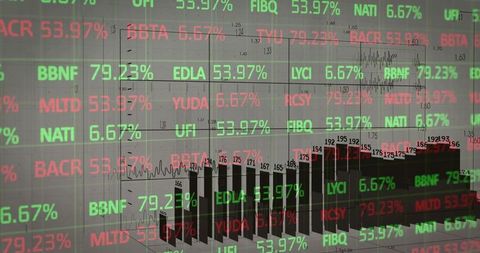
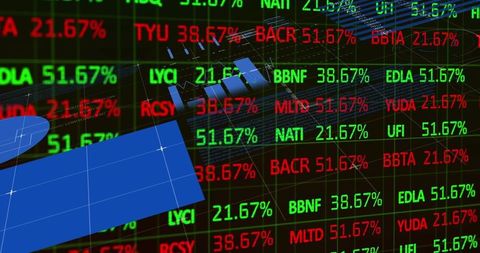
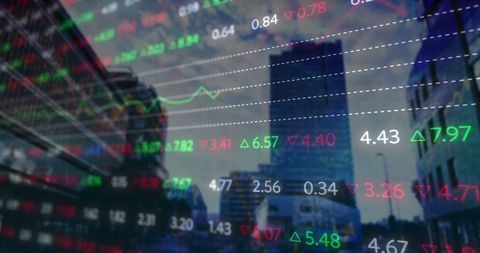
- Dashboard with Declining Financial Graphs and Dynamic Ticker Interface
Dashboard with Declining Financial Graphs and Dynamic Ticker Interface Image
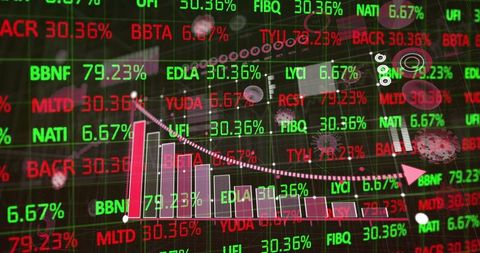
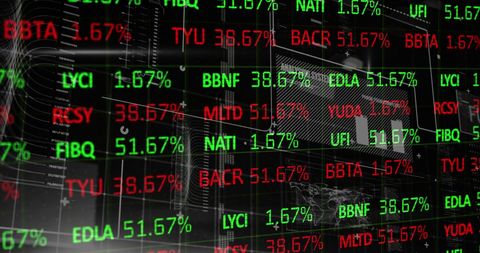
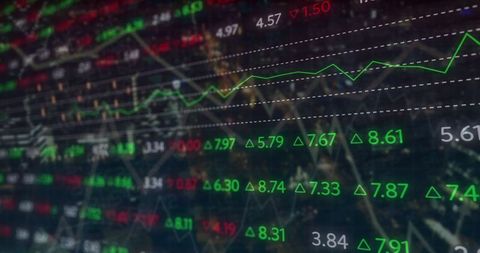
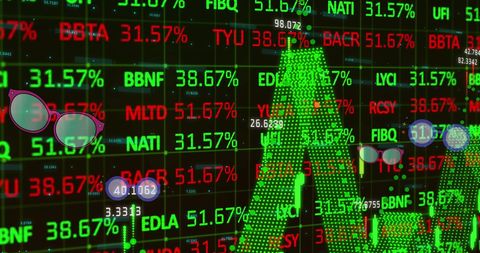
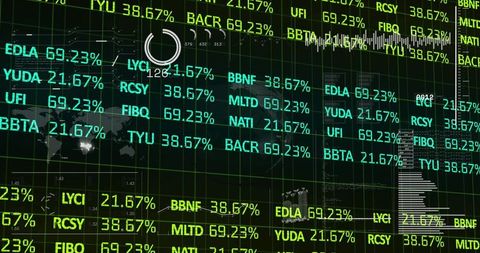
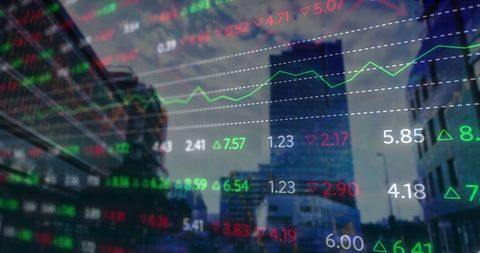
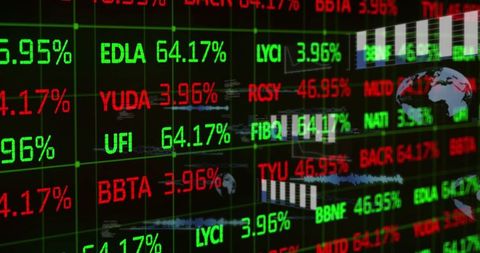
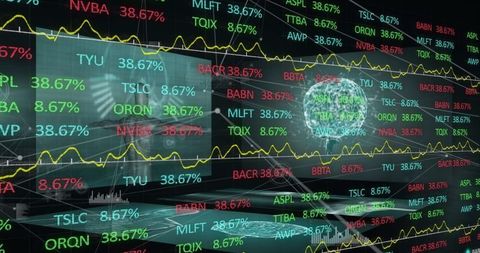
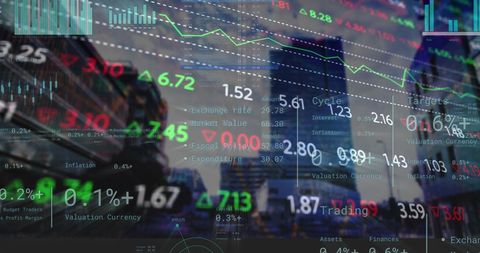
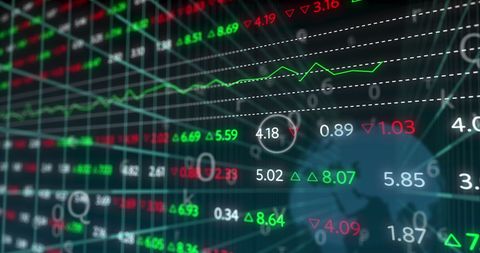
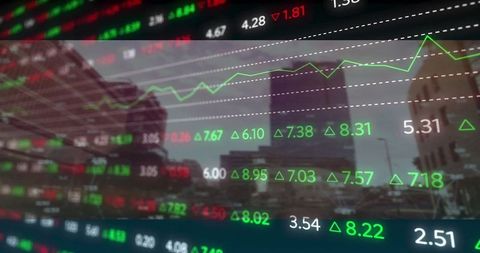
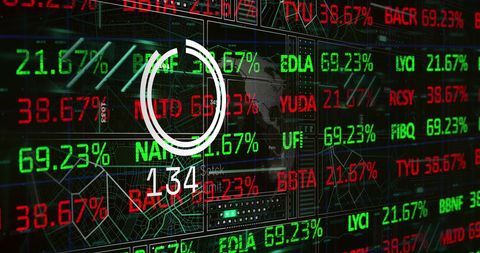
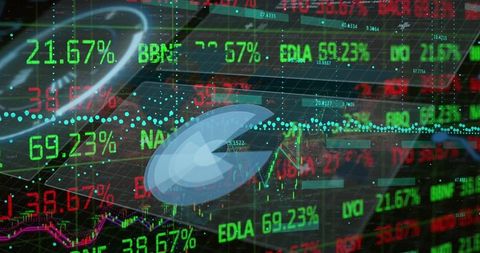
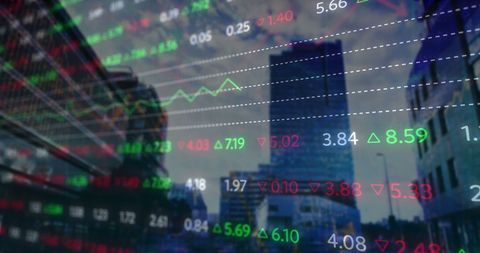
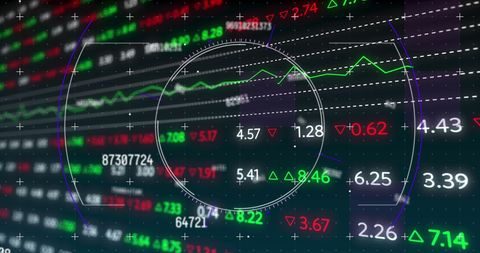
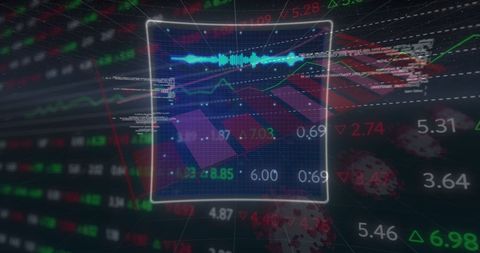
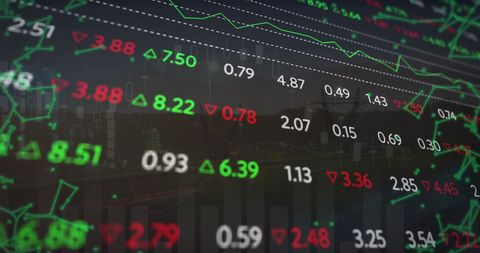
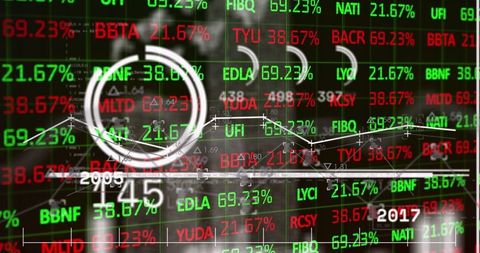
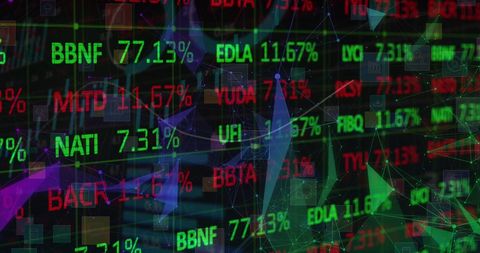
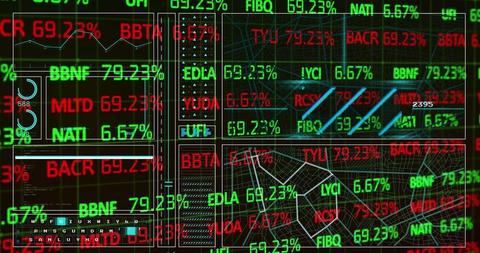
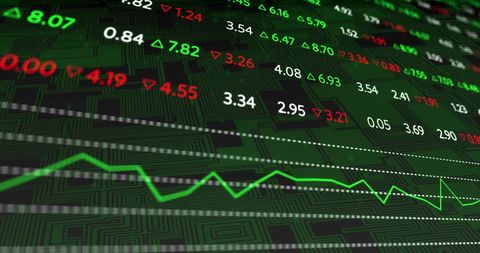
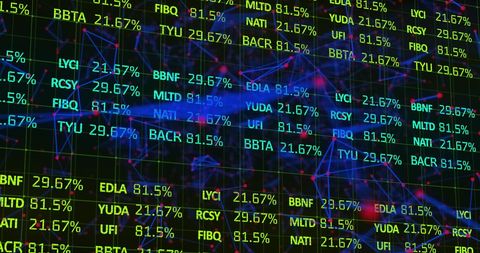
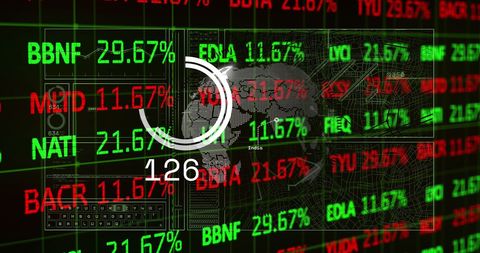
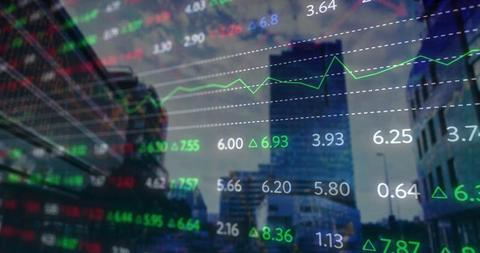
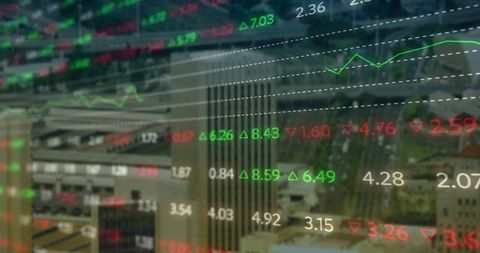
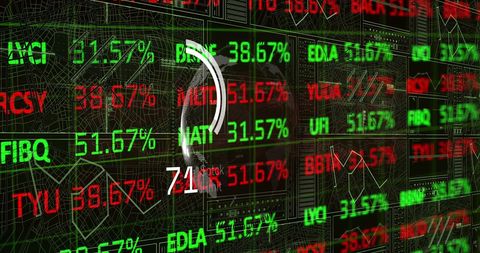
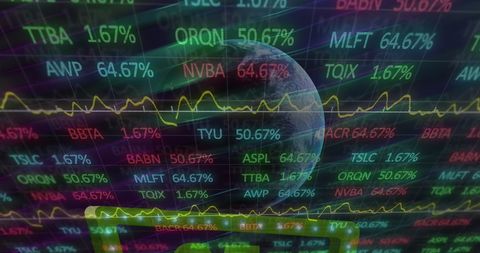
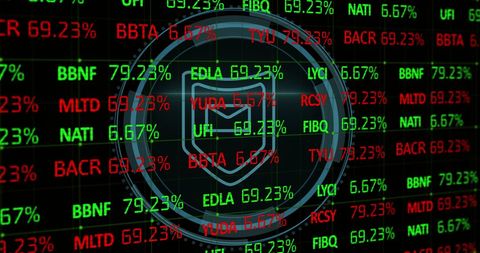
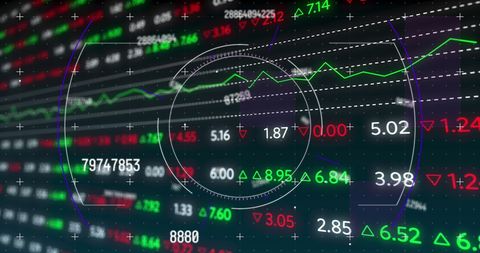
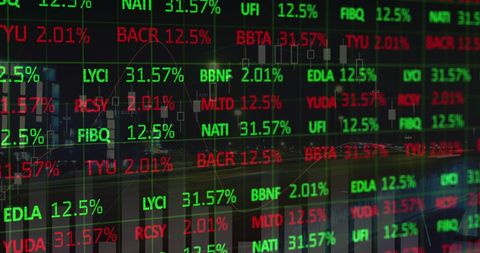
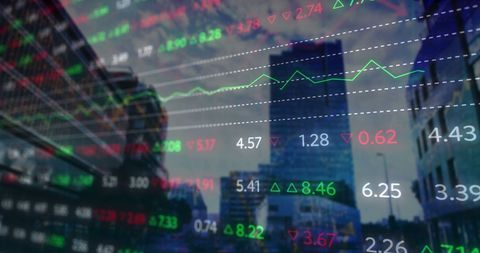
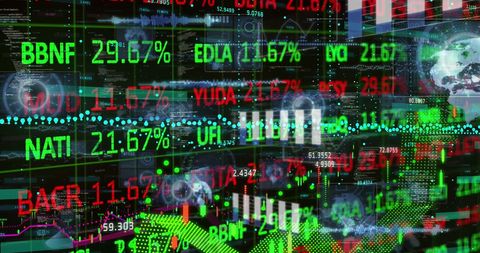
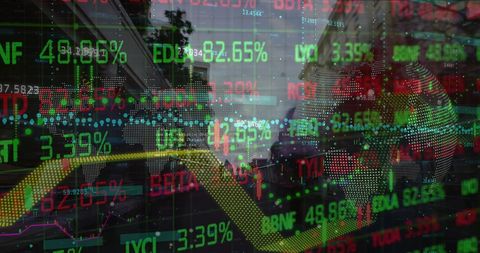
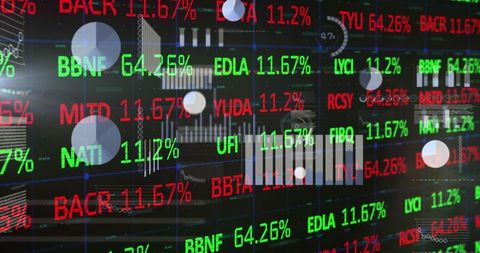
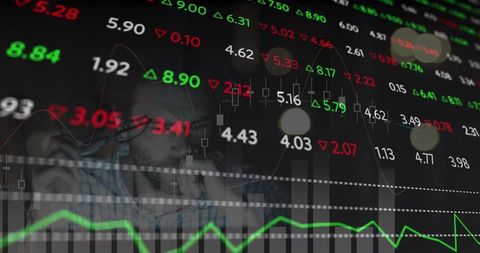
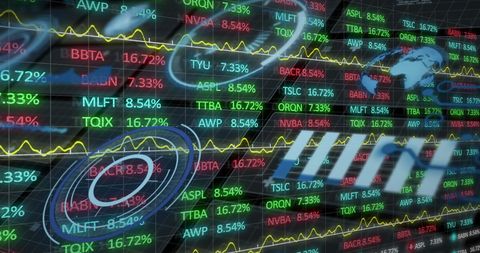
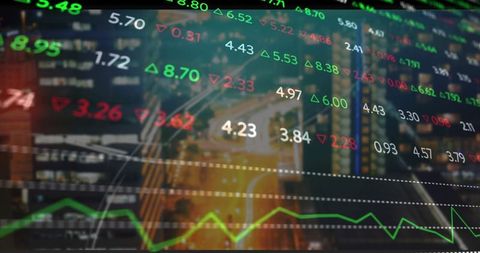
Dynamic sequence captures digital dashboard highlighting decreasing bar charts and trend lines. Ticker symbols and percentages in green and red create engaging display. Ideal for illustrating automatic trading, stock analysis, financial portfolio management, advanced data visualization, and fintech advertisements.

downloads
Tags:
More
Credit Photo
If you would like to credit the Photo, here are some ways you can do so
Text Link
photo Link
<span class="text-link">
<span>
<a target="_blank" href=https://pikwizard.com/photo/dashboard-with-declining-financial-graphs-and-dynamic-ticker-interface/e1dc6a085553de89c8ca9adbf7e8dd6a/>PikWizard</a>
</span>
</span>
<span class="image-link">
<span
style="margin: 0 0 20px 0; display: inline-block; vertical-align: middle; width: 100%;"
>
<a
target="_blank"
href="https://pikwizard.com/photo/dashboard-with-declining-financial-graphs-and-dynamic-ticker-interface/e1dc6a085553de89c8ca9adbf7e8dd6a/"
style="text-decoration: none; font-size: 10px; margin: 0;"
>
<img src="https://pikwizard.com/pw/medium/e1dc6a085553de89c8ca9adbf7e8dd6a.jpg" style="margin: 0; width: 100%;" alt="" />
<p style="font-size: 12px; margin: 0;">PikWizard</p>
</a>
</span>
</span>
Free (free of charge)
Free for personal and commercial use.
Author: Awesome Content