
- Home >
- Stock Photos >
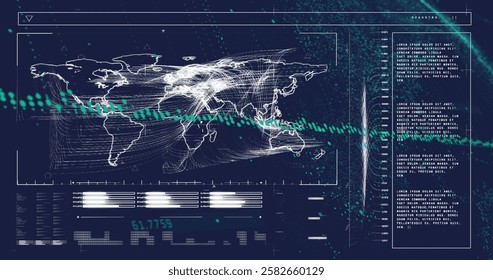
- Data Analysis Across High-Tech Server Infrastructure
Data Analysis Across High-Tech Server Infrastructure Image
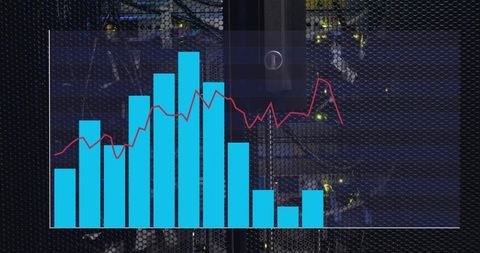
Visualization over computer server implying robust data processing and analytics in tech industry. Useful for illustrating concepts of big data handling, digital transformation, and information technology advancements in advertising, business presentations, or educational content about artificial intelligence and data science.
Powered by  - Get 15% off with code: PIKWIZARD15


downloads
Tags:
More
Credit Photo
If you would like to credit the Photo, here are some ways you can do so
Text Link
photo Link
<span class="text-link">
<span>
<a target="_blank" href=https://pikwizard.com/photo/data-analysis-across-high-tech-server-infrastructure/0331f6ad201843eb540b64562d6fa0fc/>PikWizard</a>
</span>
</span>
<span class="image-link">
<span
style="margin: 0 0 20px 0; display: inline-block; vertical-align: middle; width: 100%;"
>
<a
target="_blank"
href="https://pikwizard.com/photo/data-analysis-across-high-tech-server-infrastructure/0331f6ad201843eb540b64562d6fa0fc/"
style="text-decoration: none; font-size: 10px; margin: 0;"
>
<img src="https://pikwizard.com/pw/medium/0331f6ad201843eb540b64562d6fa0fc.jpg" style="margin: 0; width: 100%;" alt="" />
<p style="font-size: 12px; margin: 0;">PikWizard</p>
</a>
</span>
</span>
Free (free of charge)
Free for personal and commercial use.
Author: Authentic Images