- Home >
- Stock Photos >
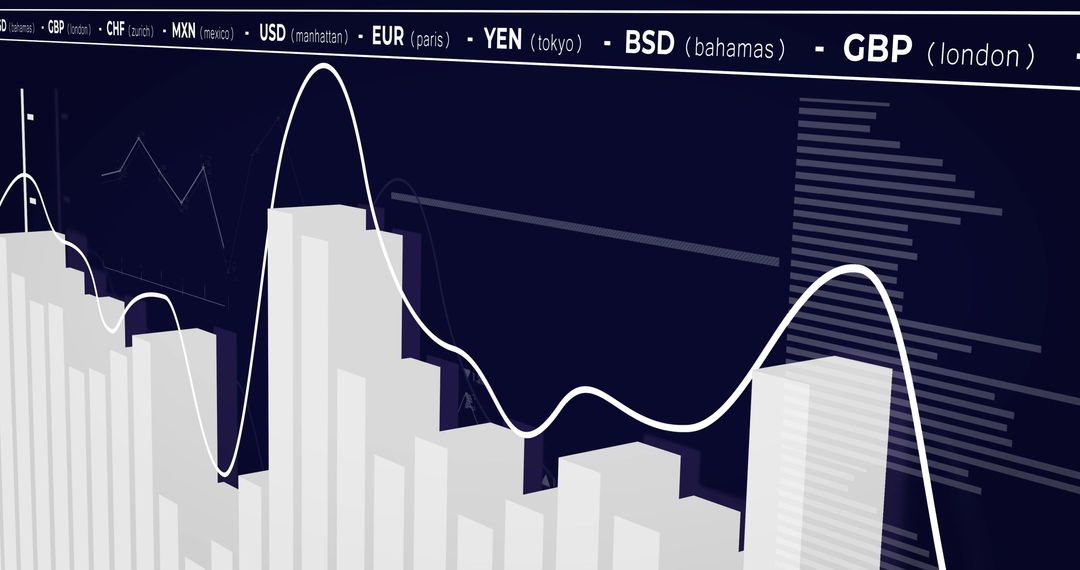
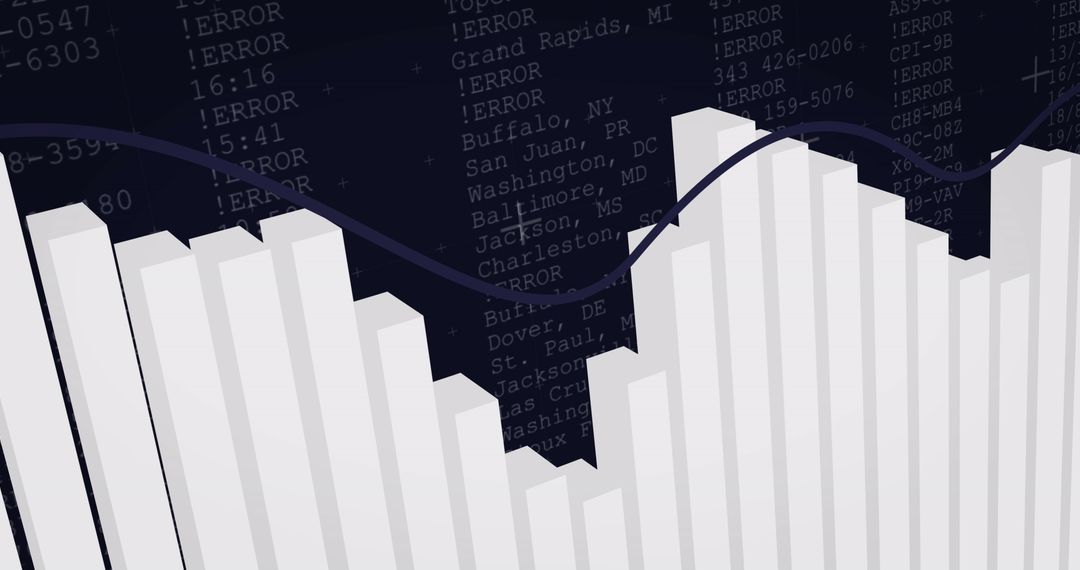
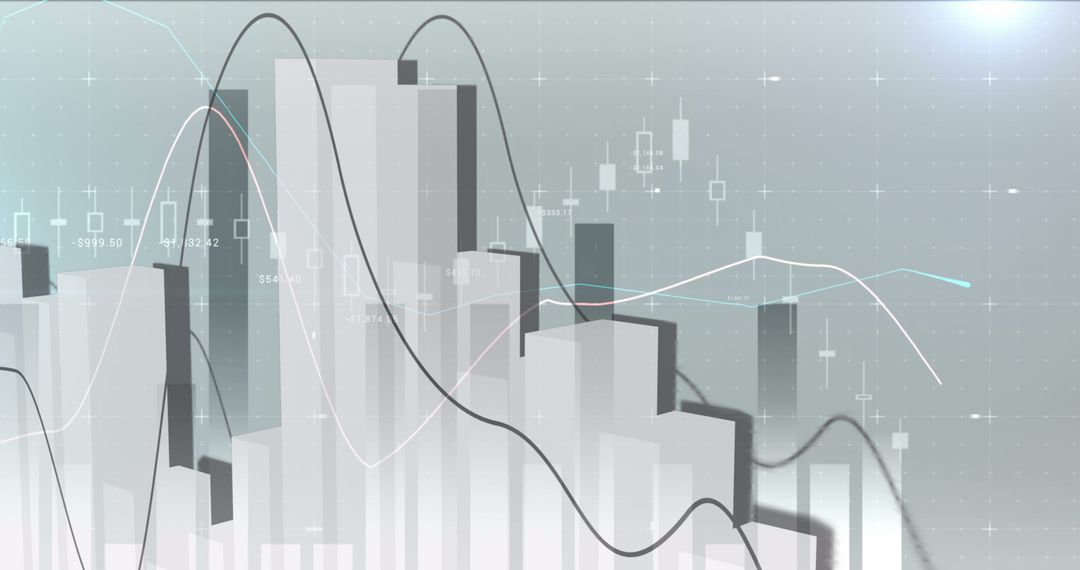
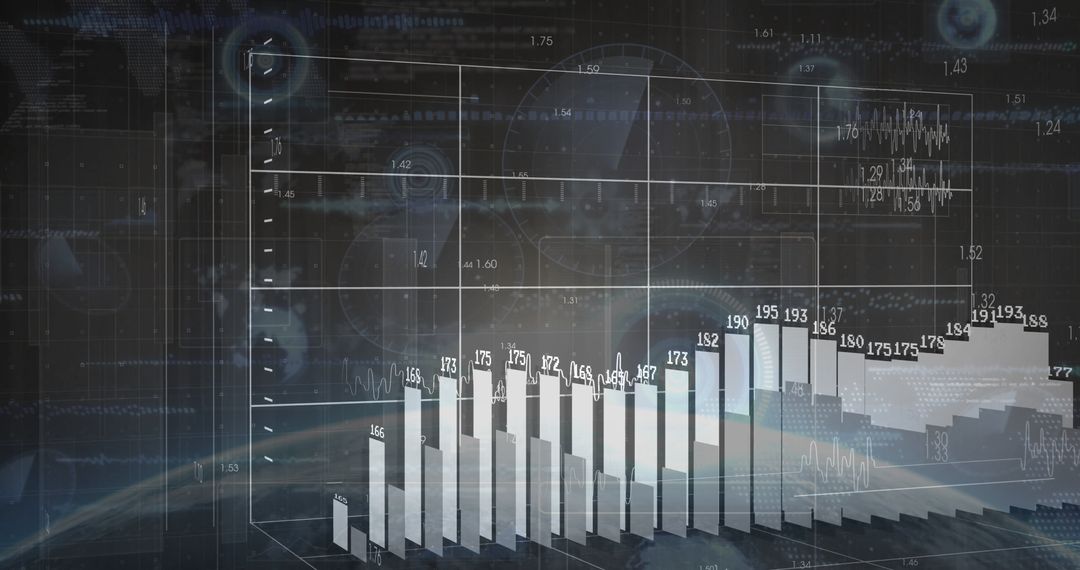
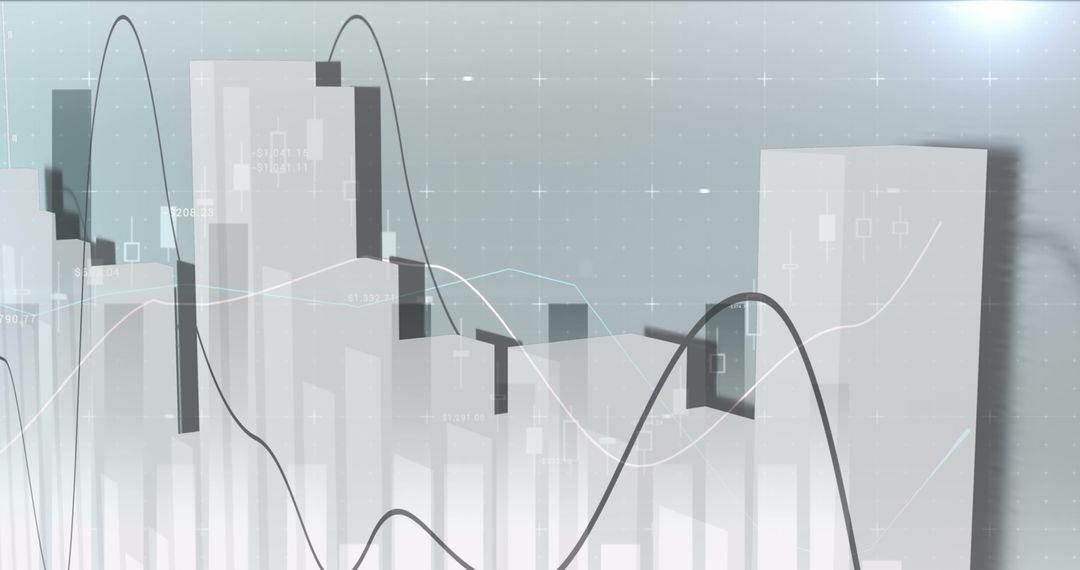
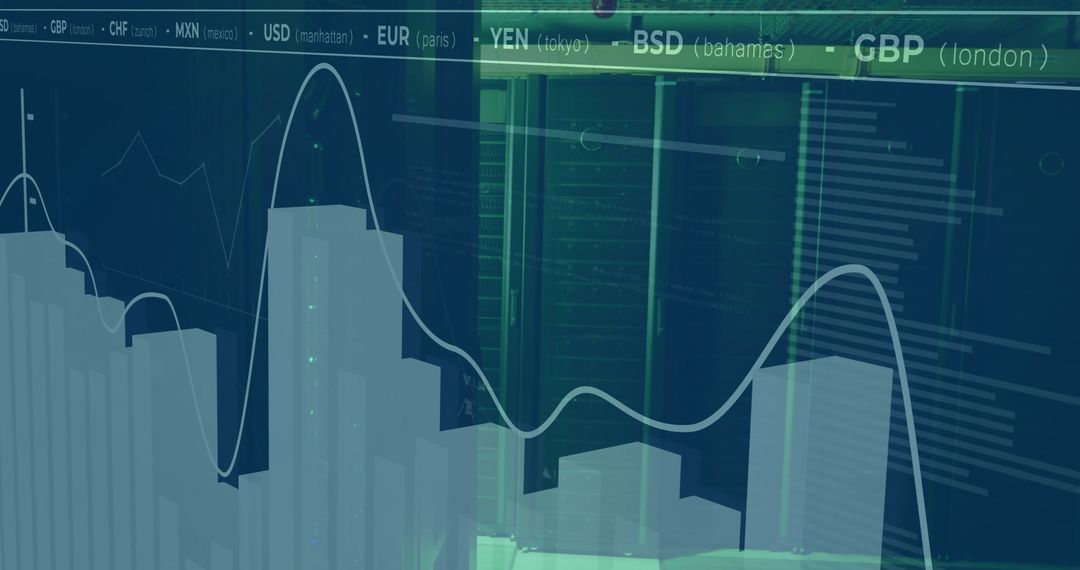
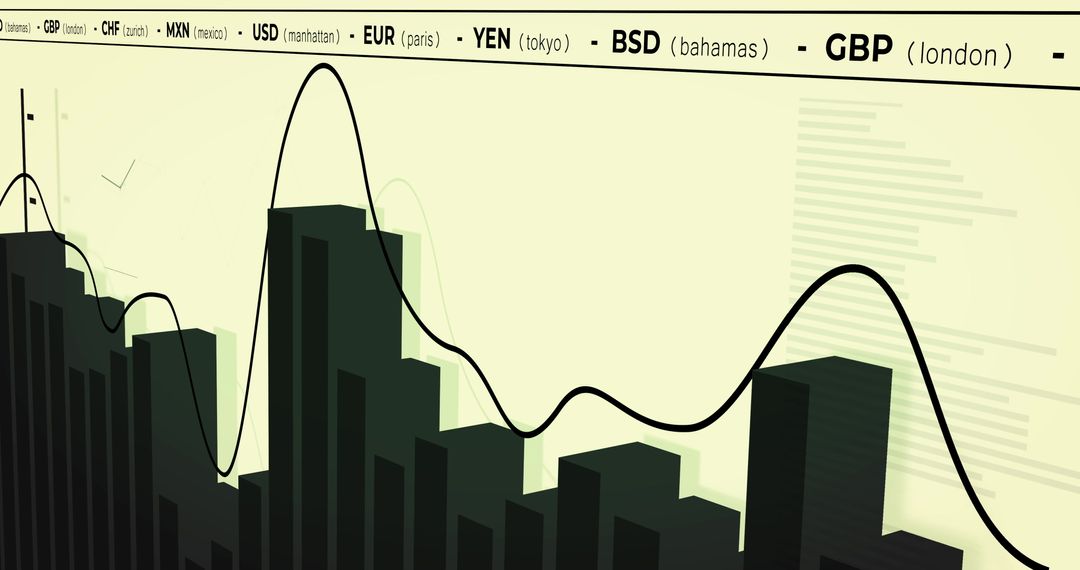
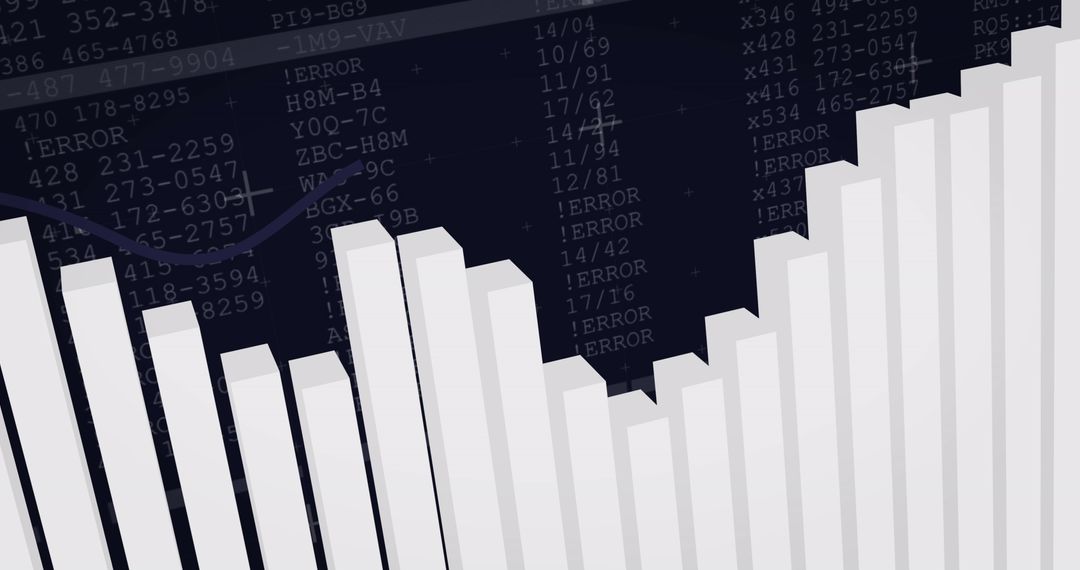
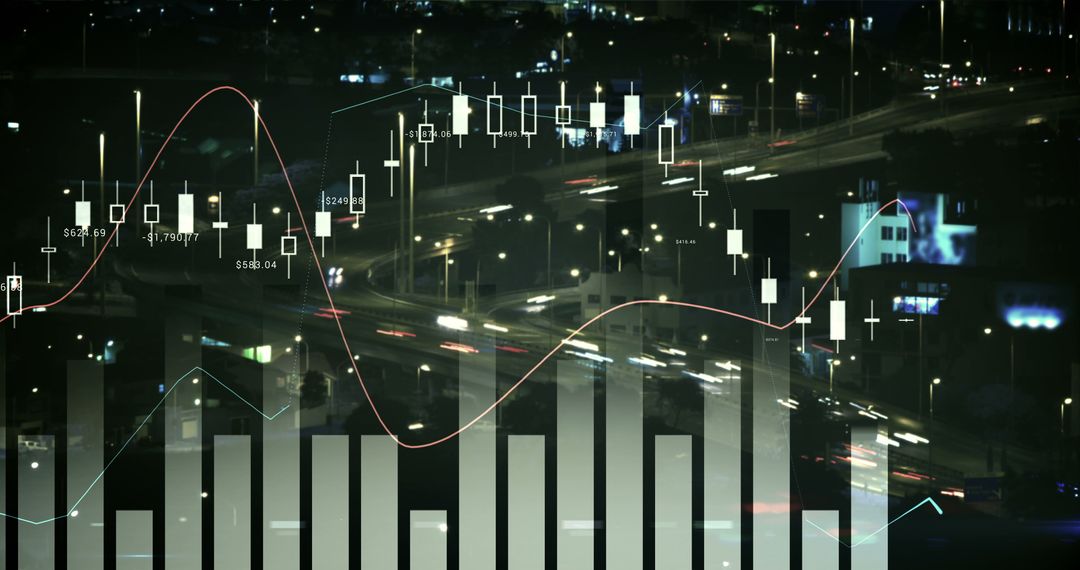
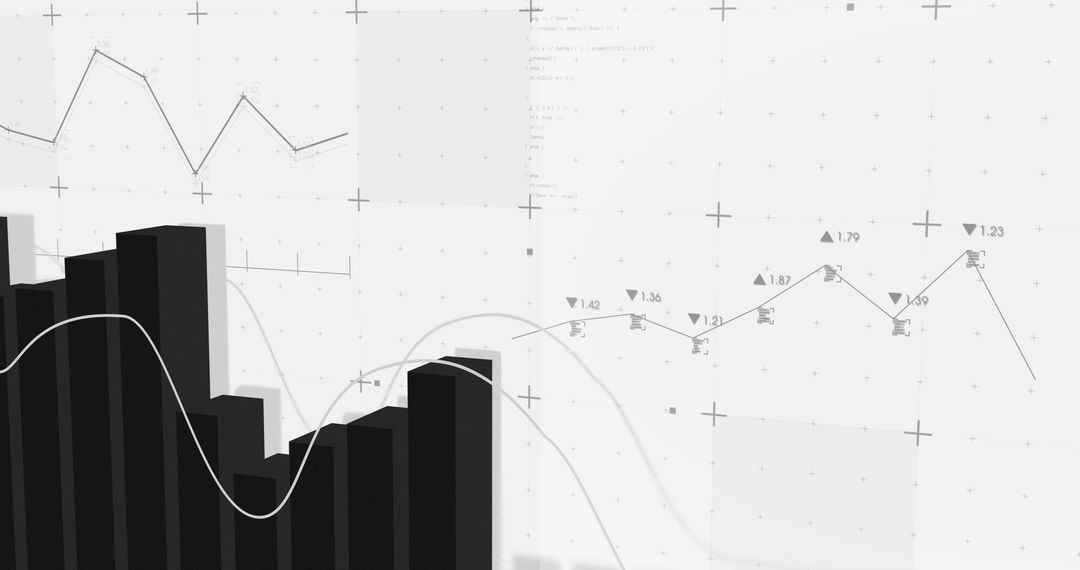
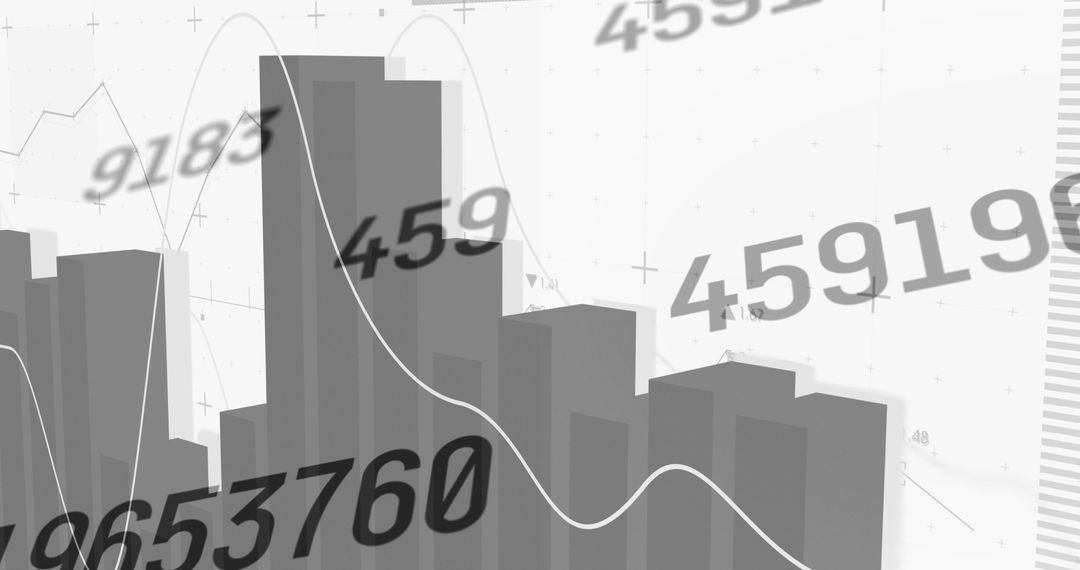
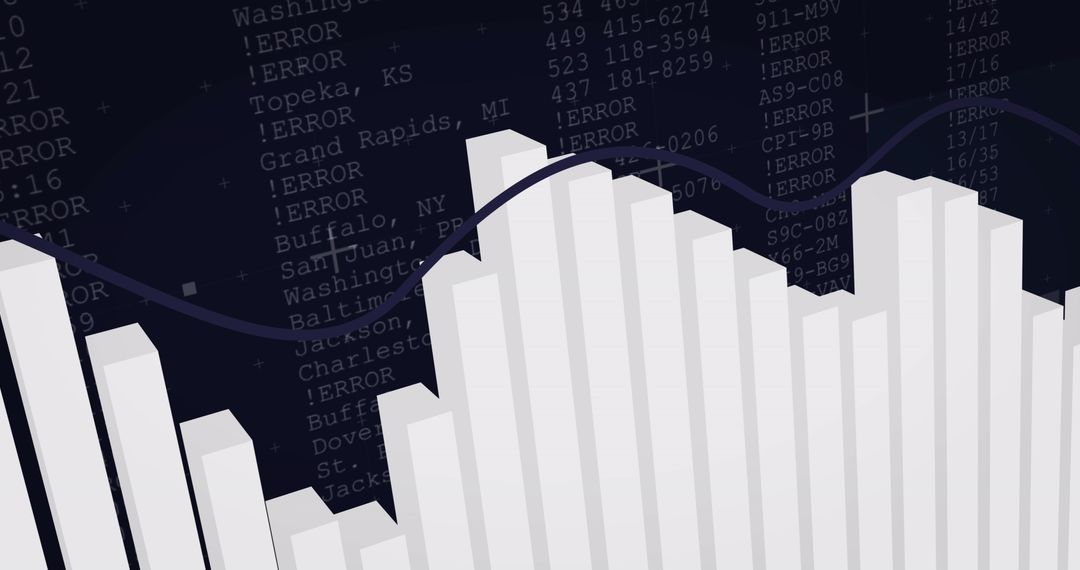
- Data Analysis and Global Business Growth with Bar Charts
Data Analysis and Global Business Growth with Bar Charts Image

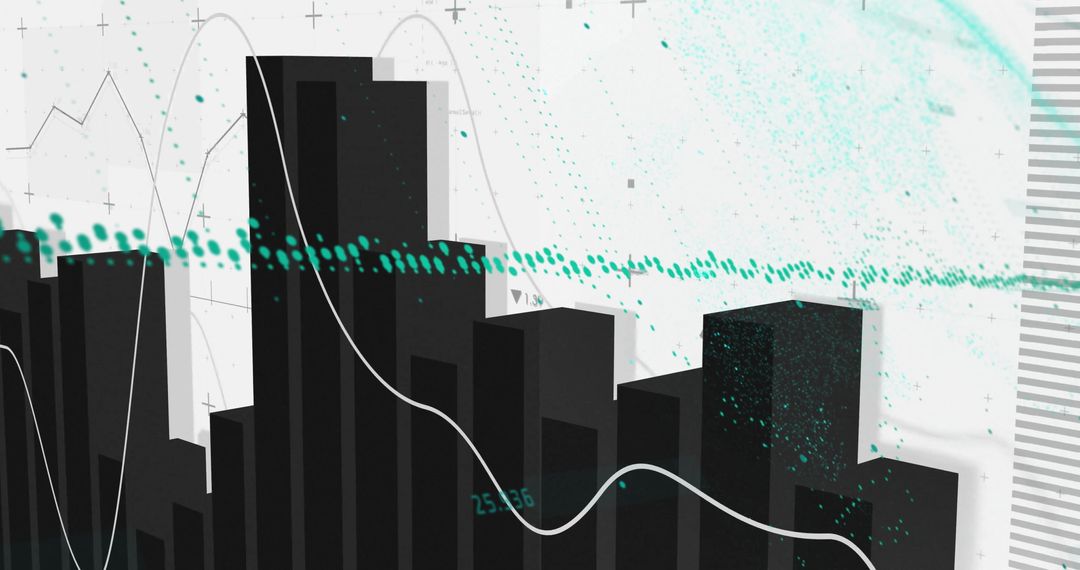
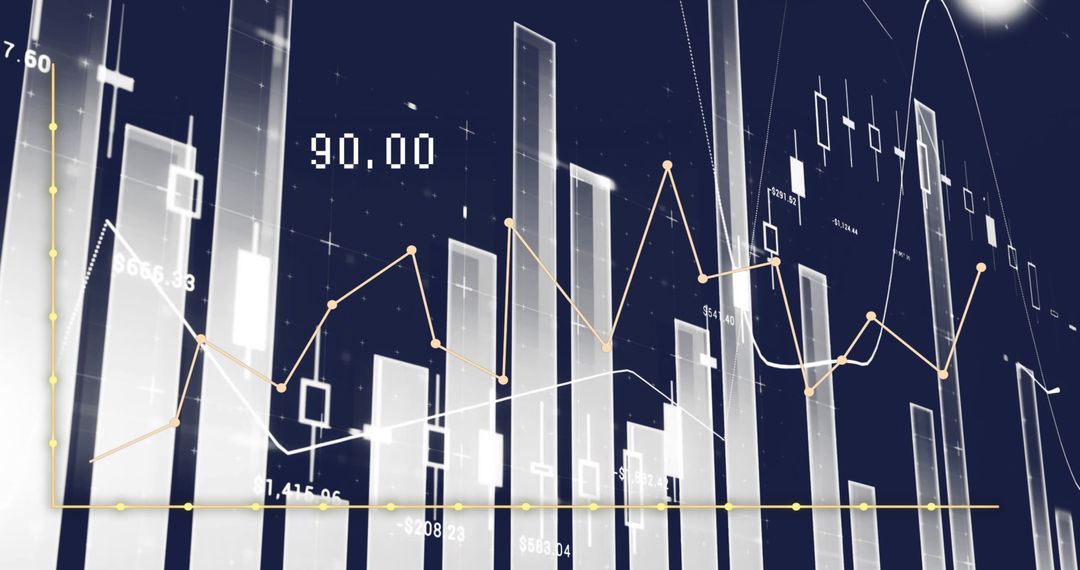
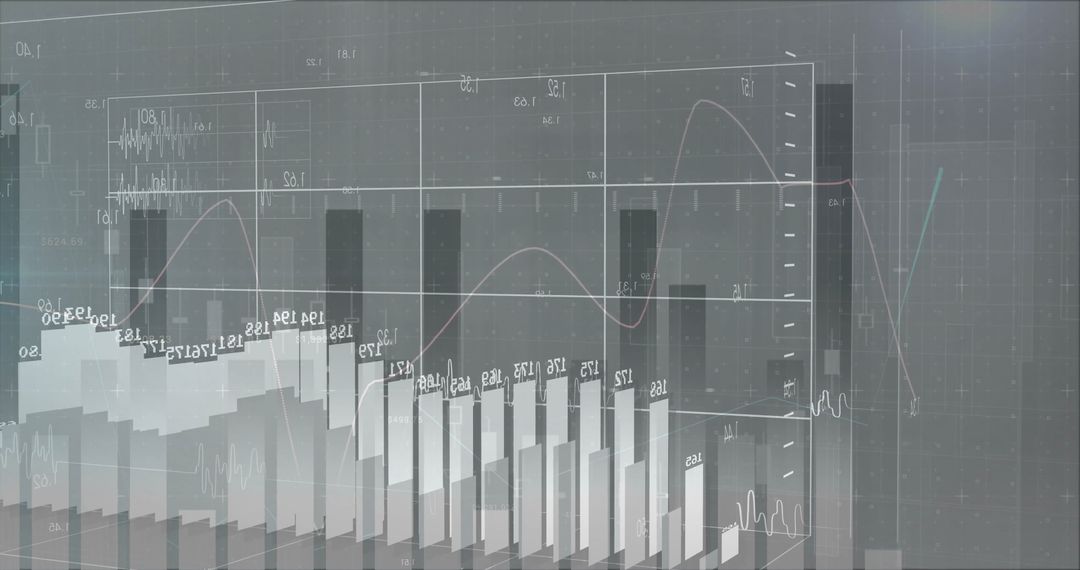
This image depicts abstract bars with waves, symbolizing data analysis, business growth, and finance management. Ideal for illustrating concepts in analytics, global economic strategies, corporate presentations, and investment portfolios. Suitable for contexts that focus on processing and visualizing data in a digital economy.
Powered by  - Get 15% off with code: PIKWIZARD15


2
downloads
downloads
Tags:
More
Credit Photo
If you would like to credit the Photo, here are some ways you can do so
Text Link
photo Link
<span class="text-link">
<span>
<a target="_blank" href=https://pikwizard.com/photo/data-analysis-and-global-business-growth-with-bar-charts/ff1c7e2ad4b44d5576603d1546a3e4a2/>PikWizard</a>
</span>
</span>
<span class="image-link">
<span
style="margin: 0 0 20px 0; display: inline-block; vertical-align: middle; width: 100%;"
>
<a
target="_blank"
href="https://pikwizard.com/photo/data-analysis-and-global-business-growth-with-bar-charts/ff1c7e2ad4b44d5576603d1546a3e4a2/"
style="text-decoration: none; font-size: 10px; margin: 0;"
>
<img src="https://pikwizard.com/pw/medium/ff1c7e2ad4b44d5576603d1546a3e4a2.jpg" style="margin: 0; width: 100%;" alt="" />
<p style="font-size: 12px; margin: 0;">PikWizard</p>
</a>
</span>
</span>
Free (free of charge)
Free for personal and commercial use.
Author: People Creations
Similar Free Stock Images
Premium


Premium


Premium


Premium


Premium


Premium


Premium


Premium


Premium


Premium


Premium


Premium


Premium


Premium


Premium


Premium


Premium


Premium


Premium

Premium


Premium


Premium


Premium


Premium