- Home >
- Stock Photos >
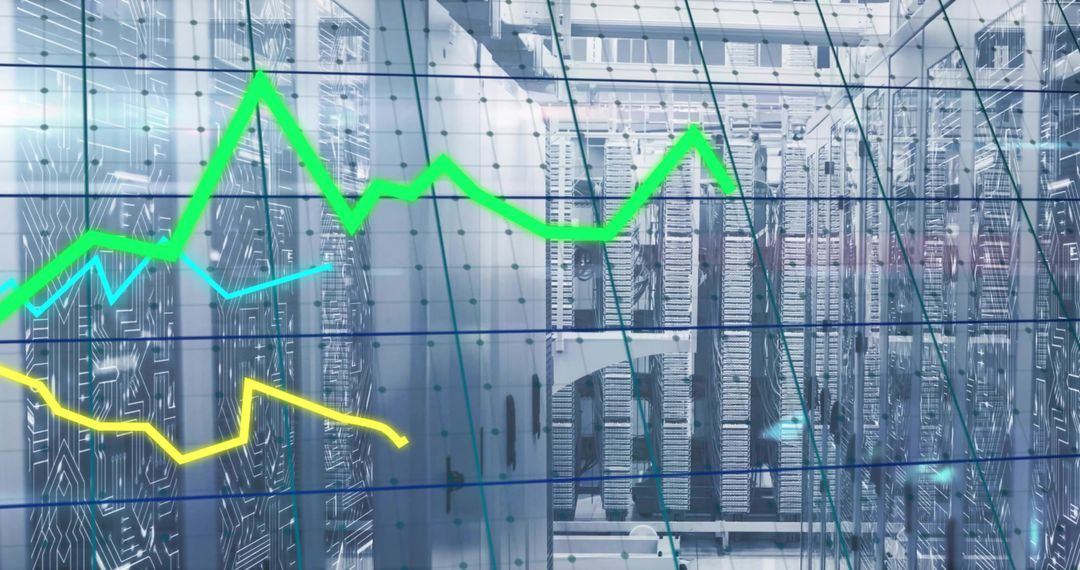
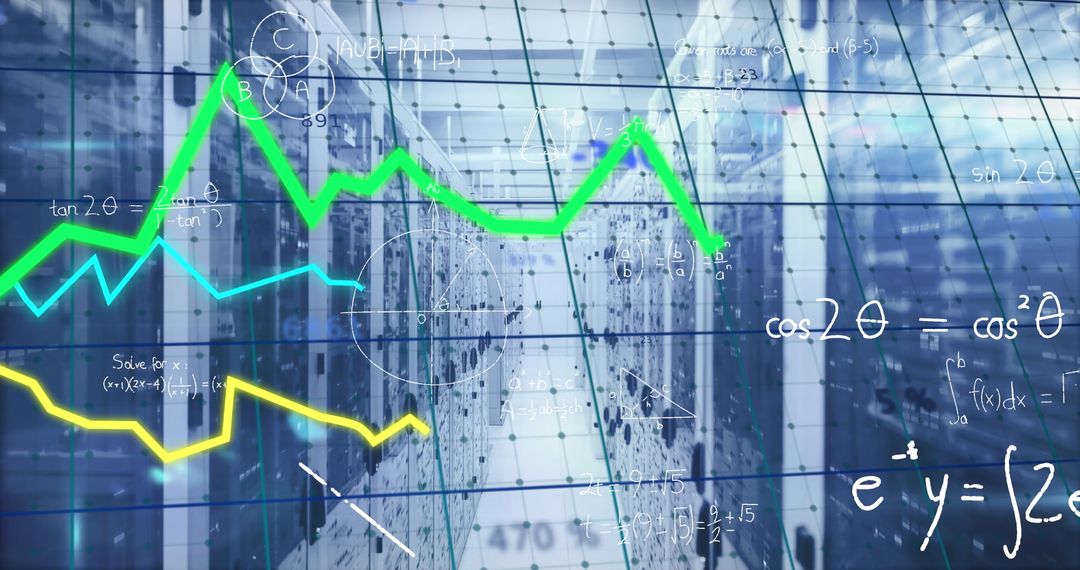
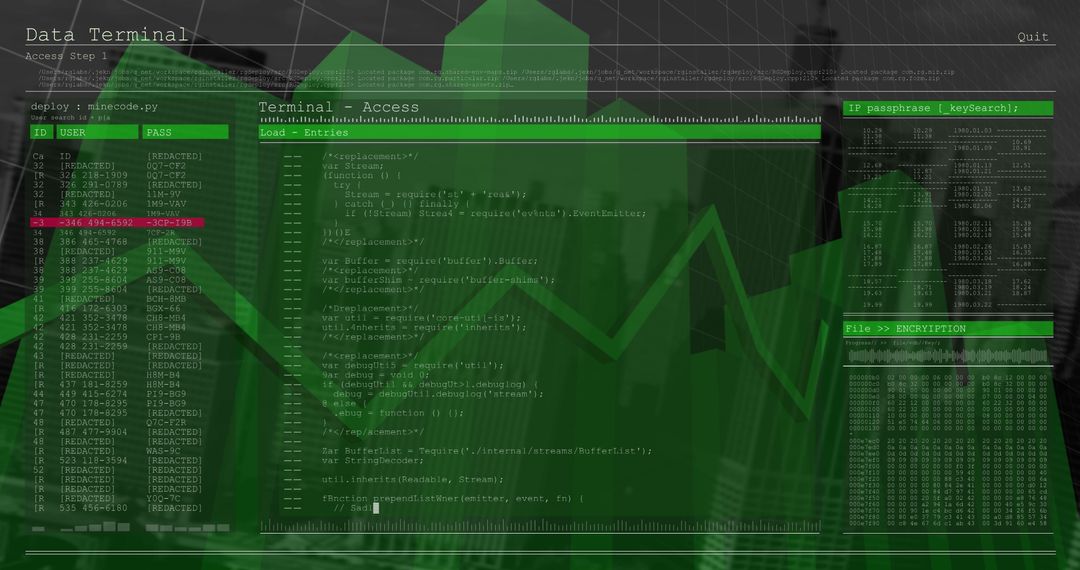
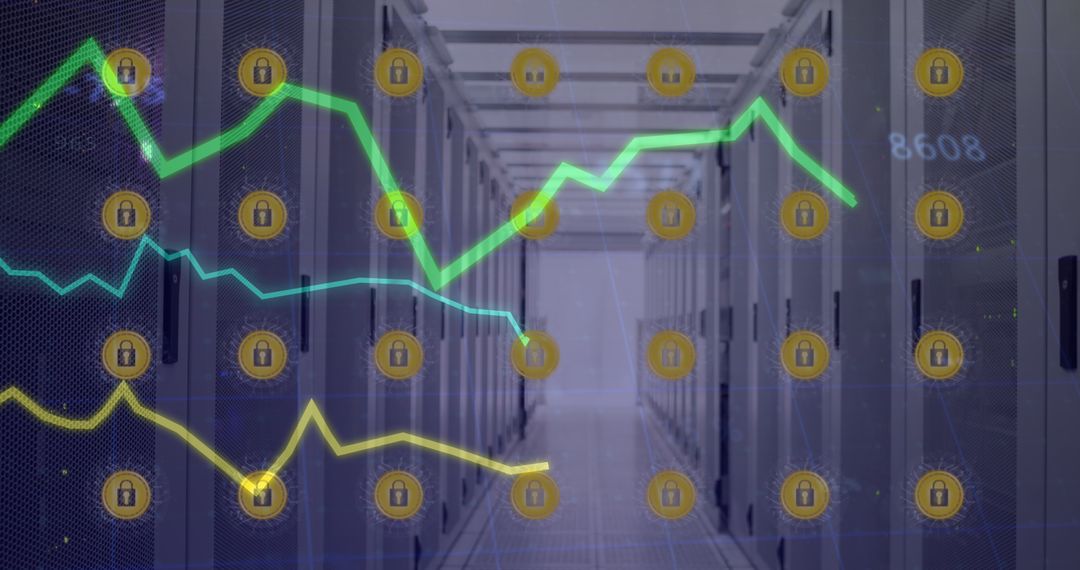
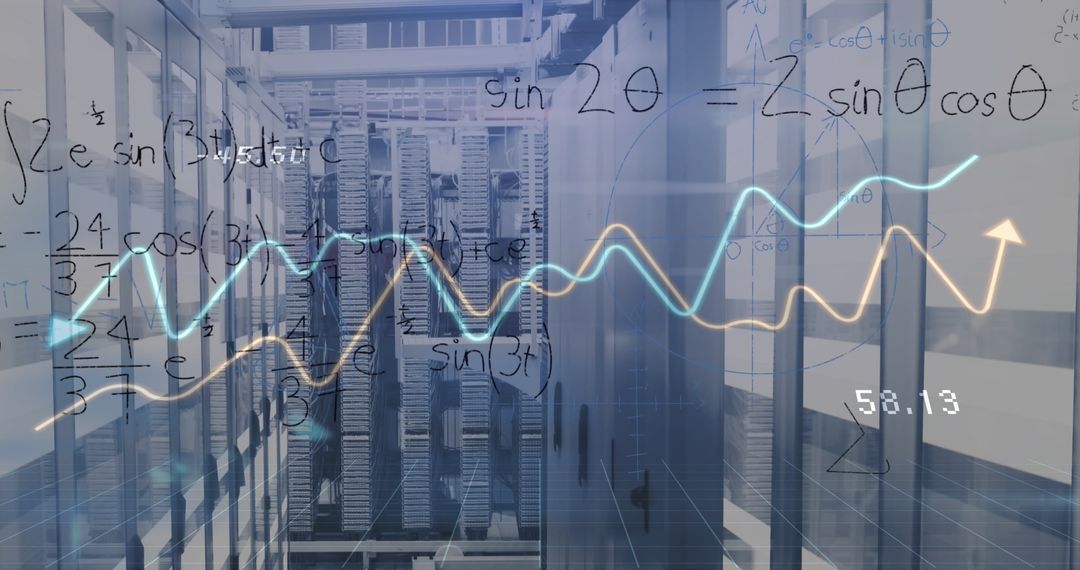
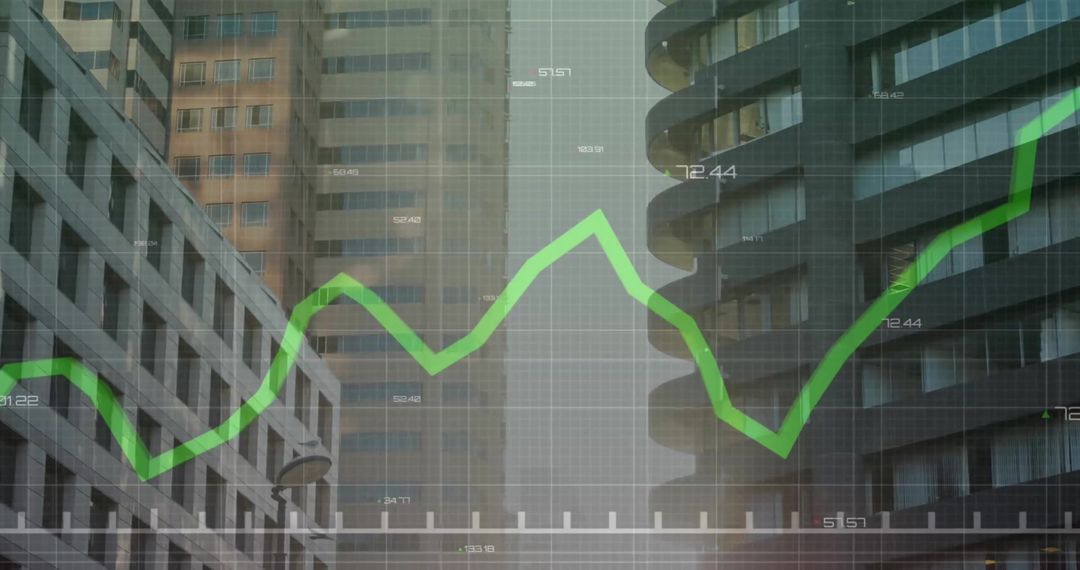
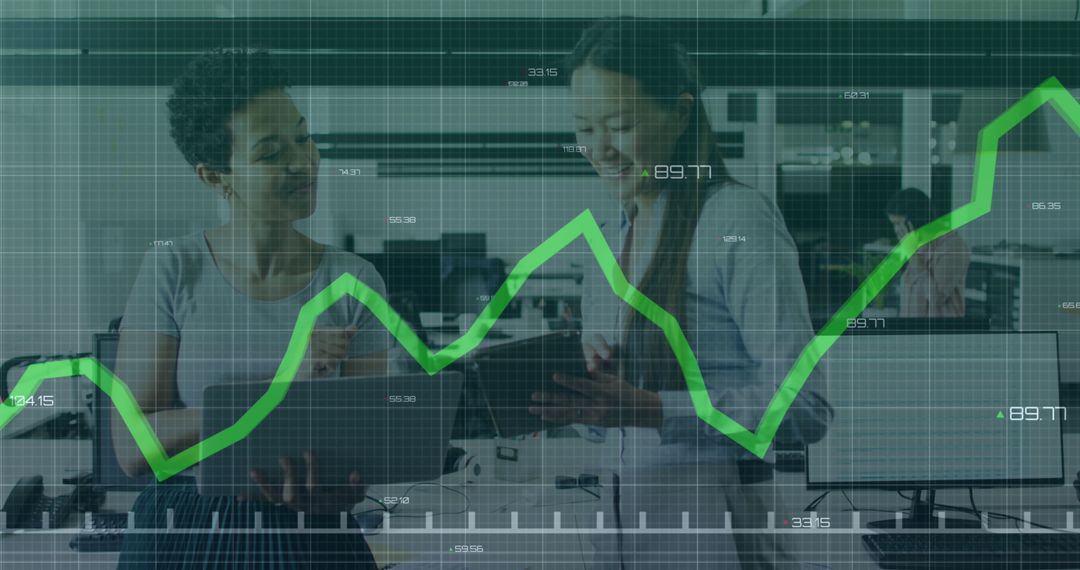
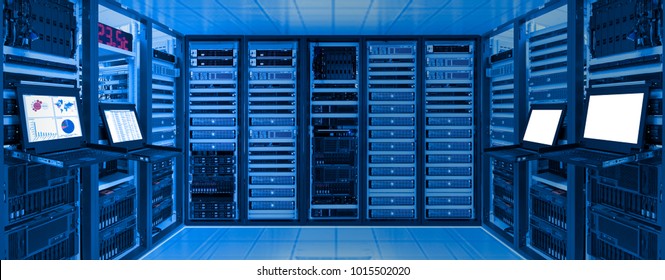
- Data Analysis and Graph Display in Modern Server Room
Data Analysis and Graph Display in Modern Server Room Image

Depicts integration of data analysis and graph analytics within a modern server room setting, highlighting business and technological communications. Useful for portraying themes of digital transformation, IT infrastructure, and performance tracking. Ideal for websites, IT services, and data management presentations.
Powered by  - Get 15% off with code: PIKWIZARD15


5
downloads
downloads
Tags:
More
Credit Photo
If you would like to credit the Photo, here are some ways you can do so
Text Link
photo Link
<span class="text-link">
<span>
<a target="_blank" href=https://pikwizard.com/photo/data-analysis-and-graph-display-in-modern-server-room/05e7260d0476fb937b2459cdd73cf164/>PikWizard</a>
</span>
</span>
<span class="image-link">
<span
style="margin: 0 0 20px 0; display: inline-block; vertical-align: middle; width: 100%;"
>
<a
target="_blank"
href="https://pikwizard.com/photo/data-analysis-and-graph-display-in-modern-server-room/05e7260d0476fb937b2459cdd73cf164/"
style="text-decoration: none; font-size: 10px; margin: 0;"
>
<img src="https://pikwizard.com/pw/medium/05e7260d0476fb937b2459cdd73cf164.jpg" style="margin: 0; width: 100%;" alt="" />
<p style="font-size: 12px; margin: 0;">PikWizard</p>
</a>
</span>
</span>
Free (free of charge)
Free for personal and commercial use.
Author: Creative Art
Similar Free Stock Images

Premium


Premium


Premium


Premium


Premium


Premium


Premium


Premium


Premium


Premium


Premium


Premium


Premium


Premium


Premium


Premium


Premium


Premium


Premium


Premium


Premium


Premium


Premium


Premium