
- Home >
- Stock Photos >
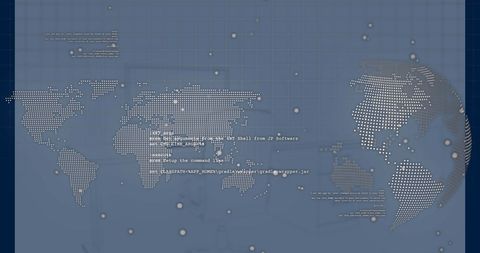
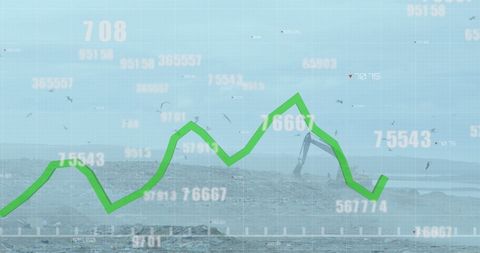
- Data Analysis and Statistics Concept Over Africa Map
Data Analysis and Statistics Concept Over Africa Map Image

Graphic of rising statistics overlaid on Africa map illustrating themes of business expansion, digital growth, and data analytics. Suitable for content on fintech, global markets, or technological innovations impacting African economies.
Powered by  - Get 15% off with code: PIKWIZARD15


downloads
Tags:
More
Credit Photo
If you would like to credit the Photo, here are some ways you can do so
Text Link
photo Link
<span class="text-link">
<span>
<a target="_blank" href=https://pikwizard.com/photo/data-analysis-and-statistics-concept-over-africa-map/038795792526a8841047dc8df14a8929/>PikWizard</a>
</span>
</span>
<span class="image-link">
<span
style="margin: 0 0 20px 0; display: inline-block; vertical-align: middle; width: 100%;"
>
<a
target="_blank"
href="https://pikwizard.com/photo/data-analysis-and-statistics-concept-over-africa-map/038795792526a8841047dc8df14a8929/"
style="text-decoration: none; font-size: 10px; margin: 0;"
>
<img src="https://pikwizard.com/pw/medium/038795792526a8841047dc8df14a8929.jpg" style="margin: 0; width: 100%;" alt="" />
<p style="font-size: 12px; margin: 0;">PikWizard</p>
</a>
</span>
</span>
Free (free of charge)
Free for personal and commercial use.
Author: People Creations
Similar Free Stock Images
Loading...

Premium


Premium

Premium


Premium


Premium

Premium

Premium

Premium


Premium


Premium


Premium

Premium


Explore More Free Stock Images