- Home >
- Stock Photos >
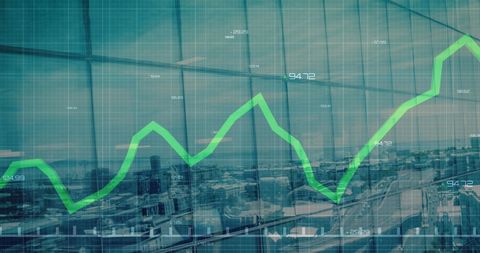
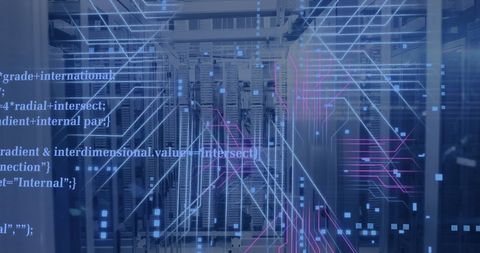
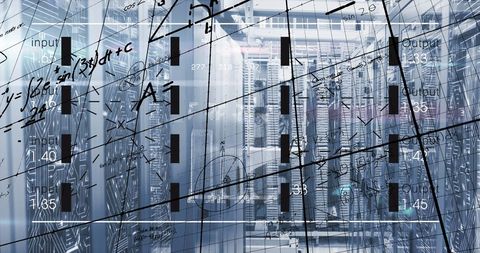
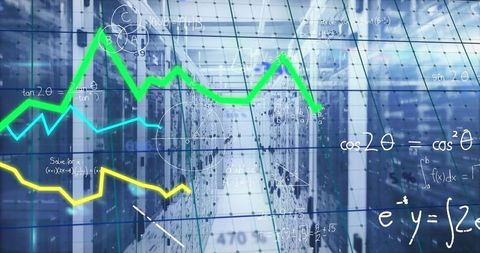
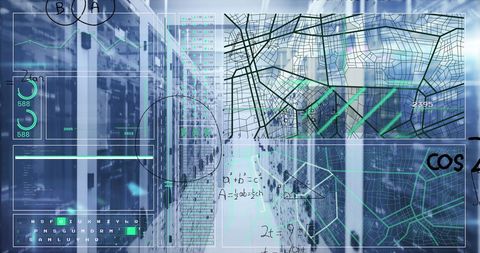
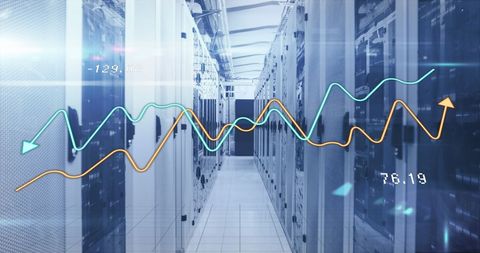
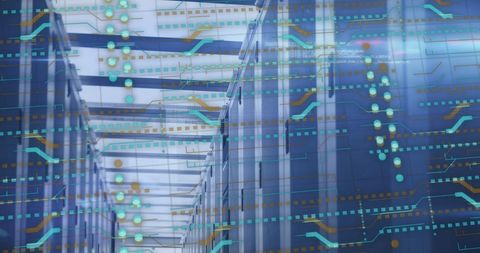
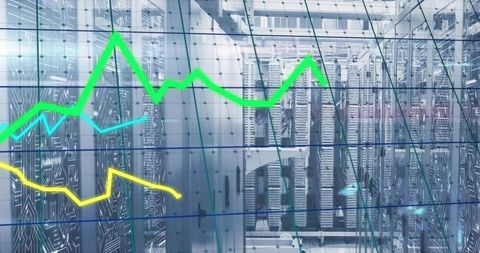
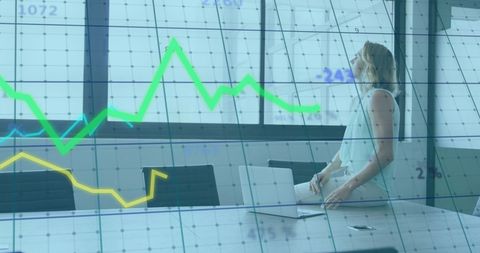
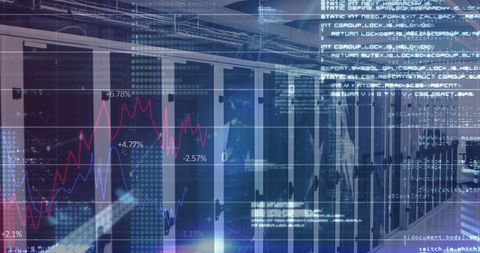
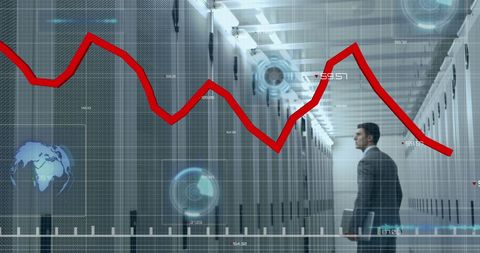
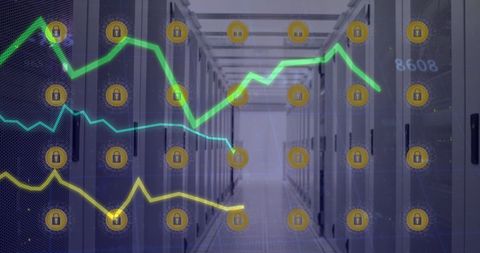
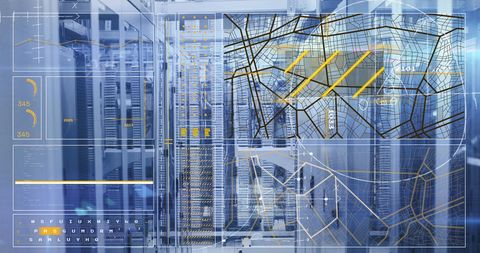
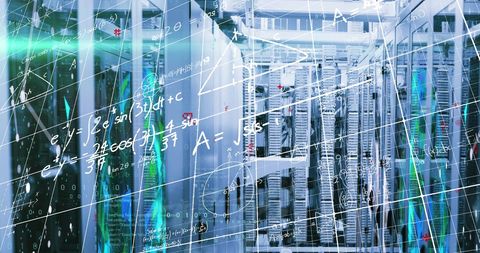
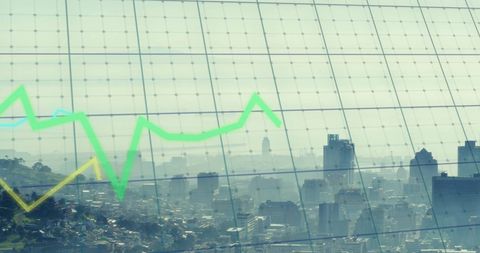
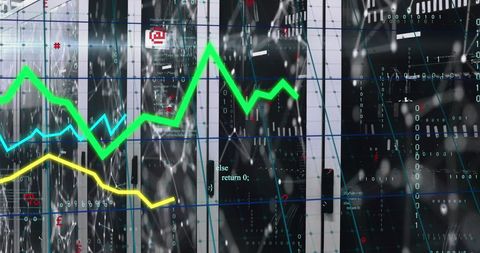
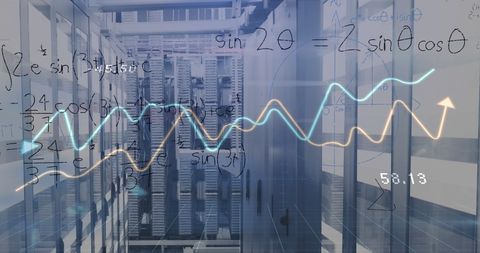
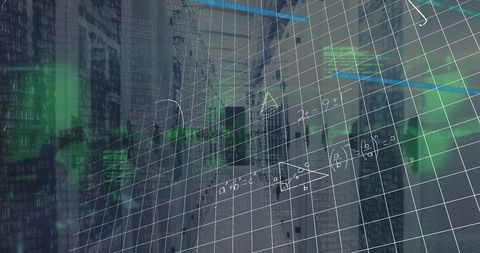
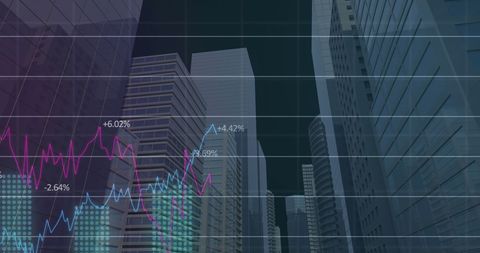
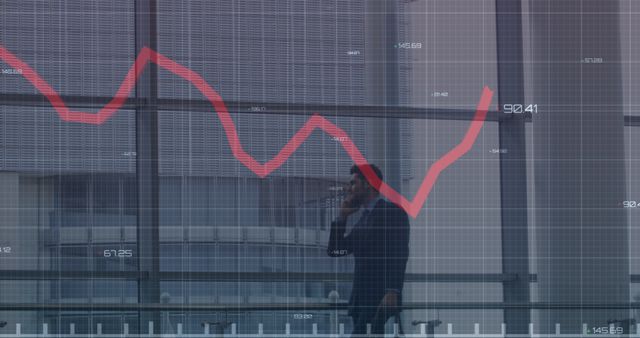
- Data Analysis and Technology in Server Room Digital Interface
Data Analysis and Technology in Server Room Digital Interface Image
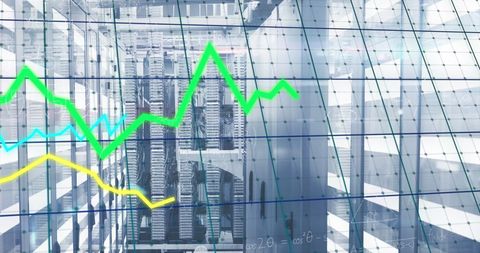
Visual representation merging server room and data analysis illustrates the integration of technology in maintaining data networks. Useful for topics on IT infrastructure, cloud storage solutions, and data security innovations. Ideal for technology presentations, corporate websites, or educational materials focusing on computing advancements and big data management.

downloads
Tags:
More
Credit Photo
If you would like to credit the Photo, here are some ways you can do so
Text Link
photo Link
<span class="text-link">
<span>
<a target="_blank" href=https://pikwizard.com/photo/data-analysis-and-technology-in-server-room-digital-interface/436488262bda64a1b1d89bc4e756d5ab/>PikWizard</a>
</span>
</span>
<span class="image-link">
<span
style="margin: 0 0 20px 0; display: inline-block; vertical-align: middle; width: 100%;"
>
<a
target="_blank"
href="https://pikwizard.com/photo/data-analysis-and-technology-in-server-room-digital-interface/436488262bda64a1b1d89bc4e756d5ab/"
style="text-decoration: none; font-size: 10px; margin: 0;"
>
<img src="https://pikwizard.com/pw/medium/436488262bda64a1b1d89bc4e756d5ab.jpg" style="margin: 0; width: 100%;" alt="" />
<p style="font-size: 12px; margin: 0;">PikWizard</p>
</a>
</span>
</span>
Free (free of charge)
Free for personal and commercial use.
Author: Awesome Content