
- Home >
- Stock Photos >
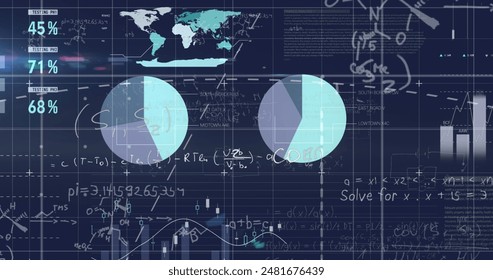
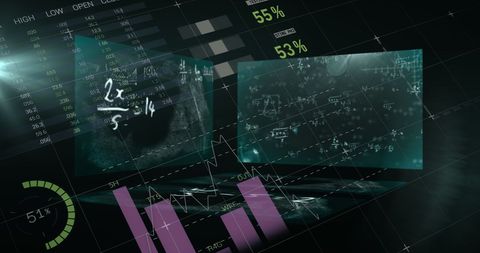
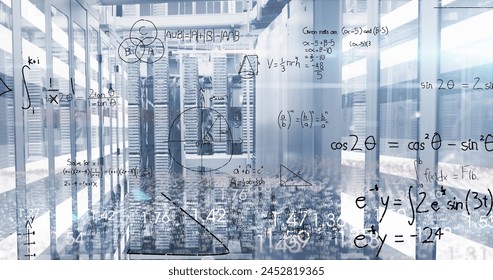
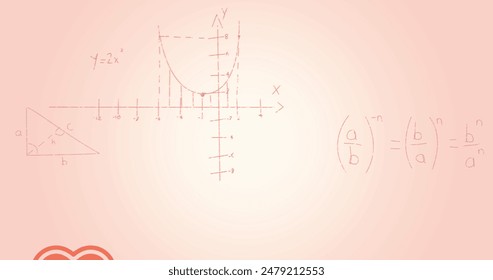
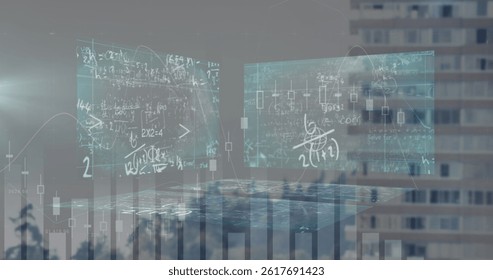
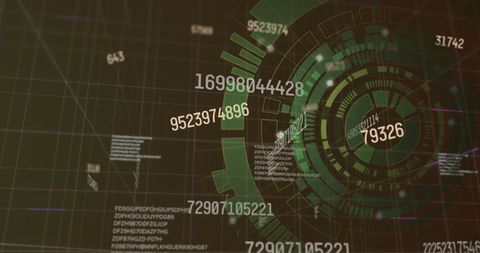
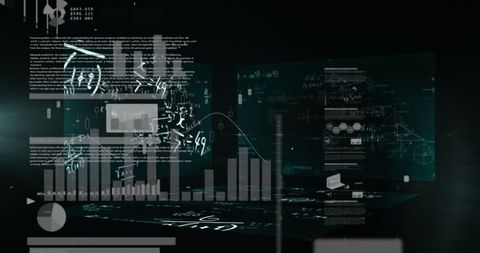
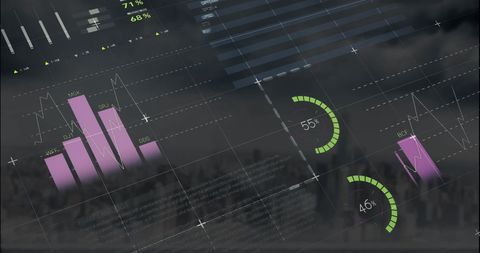
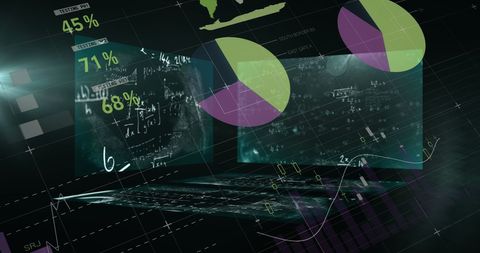
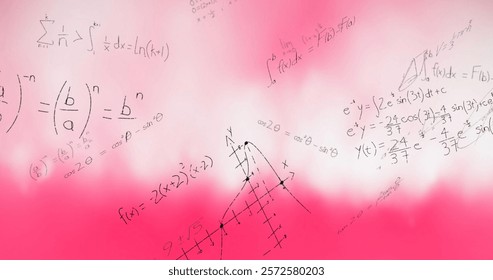
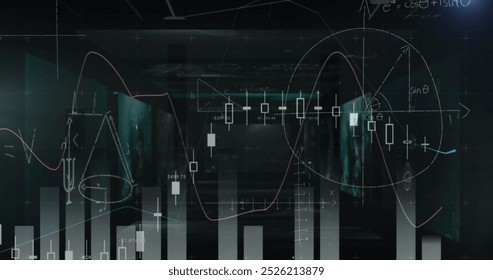
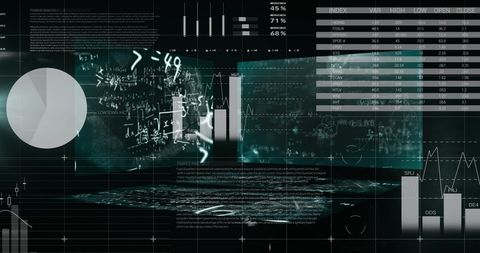
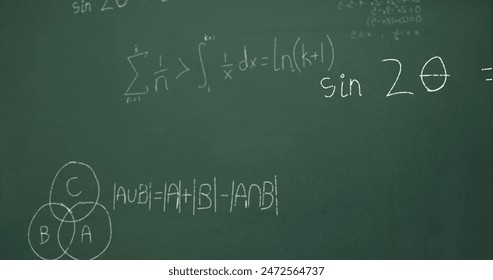
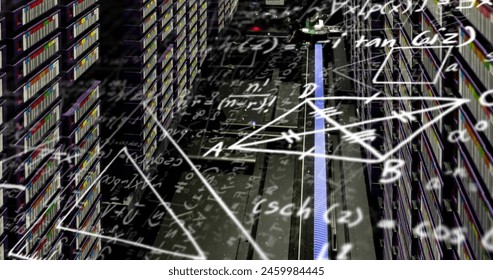
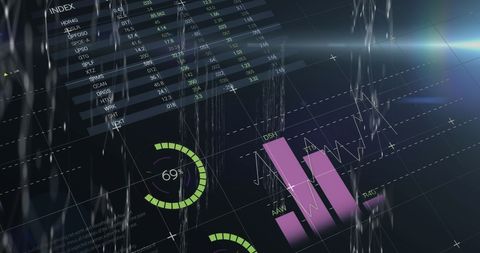
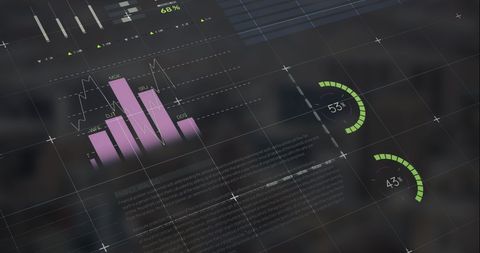
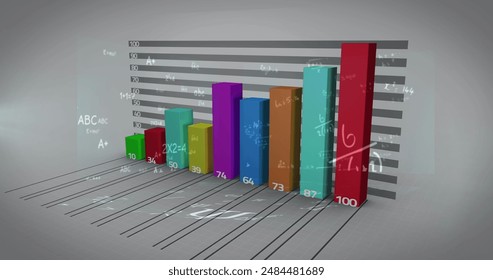
- Data Analysis and Technology Screens with Mathematical Equations
Data Analysis and Technology Screens with Mathematical Equations Image

Numerous mathematical equations and data are displayed on overlapped digital screens in a dark theme with abstract graph projections, reflecting an aura of modern data processing. Suggested uses include presentations and articles that deal with data analytics, finance, digital technology strategies, or educational content about statistics and mathematics.
Powered by  - Get 15% off with code: PIKWIZARD15


downloads
Tags:
More
Credit Photo
If you would like to credit the Photo, here are some ways you can do so
Text Link
photo Link
<span class="text-link">
<span>
<a target="_blank" href=https://pikwizard.com/photo/data-analysis-and-technology-screens-with-mathematical-equations/5a219f9f333d5be5a85f3f49d100930a/>PikWizard</a>
</span>
</span>
<span class="image-link">
<span
style="margin: 0 0 20px 0; display: inline-block; vertical-align: middle; width: 100%;"
>
<a
target="_blank"
href="https://pikwizard.com/photo/data-analysis-and-technology-screens-with-mathematical-equations/5a219f9f333d5be5a85f3f49d100930a/"
style="text-decoration: none; font-size: 10px; margin: 0;"
>
<img src="https://pikwizard.com/pw/medium/5a219f9f333d5be5a85f3f49d100930a.jpg" style="margin: 0; width: 100%;" alt="" />
<p style="font-size: 12px; margin: 0;">PikWizard</p>
</a>
</span>
</span>
Free (free of charge)
Free for personal and commercial use.
Author: Creative Art
Similar Free Stock Images

Premium

Premium
Premium


Premium


Premium


Premium


Premium


Premium
Premium
Premium

Premium


Premium


Premium


Premium


Premium


Premium


Premium


Premium


Premium


Premium


Premium

Premium


Premium


Premium


Premium


Explore More Free Stock Images