1. Home > 
  2. Stock Photos > 
  3. Data Analysis and Visualization on European Map Concept

Data Analysis and Visualization on European Map Concept Image

Data Analysis and Visualization on European Map Concept

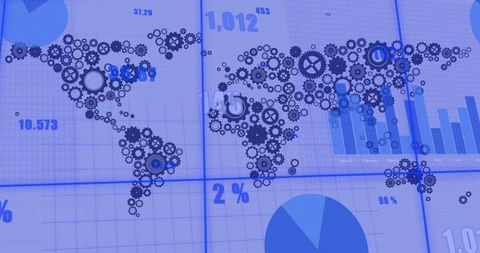
This abstract image combines elements of data visualization including graphs and statistical data with a backdrop of a European map. Useful for illustrating concepts related to global business analysis, financial markets, and data processing. Ideal for presentations, digital content, or advertising materials focused on international communication or business strategies.

Powered by Adobe logo
A stunning digital map of Europe, showcasing interconnected data points against a deep blue backdrop, Ideal for technology, connectivity, and geography themes in presentations or articles, - Powered by AdobeWorld map with charts, graphs and diagrams - Powered by AdobeA heat map illustrating high temperatures across Europe, highlighting climate change impact and the severity of rising global temperatures. - Powered by AdobeA heat map of Europe showing temperature variations across the continent. The map is color-coded from blue (coldest) to red (warmest). - Powered by AdobeOpen laptop with a glowing screen displaying charts or data visualizations, set against a large Spanish flag backdrop. - Powered by Adobe

Credit Photo

If you would like to credit the Photo, here are some ways you can do so

Free (free of charge)

Free for personal and commercial use.

Author: People Creations

Similar Free Stock Images

Futuristic Digital Interface with Multiscreen Analytics Panels
Premium
Highlighting High-Crime Zones in European City Map for Awareness and Decision-Making
European Stock Market Data Analysis
Global Finance with Digital Data and Interfaces
Abstract Digital Financial Data Network Concept
Global Connectivity in Data and Financial Markets Conceptual Design
Premium
A luminous world map focused on Africa surrounded by cascading data waves, illustrating global analytics, population connectivity and the planetary scale of modern information systems.
Digital Interface with Globe and Floating Data Graphics
Data Analysis with Network of Financial Connections and Graphs
Digital Globe and Tech Blueprints Connecting Innovation
Global Trends in Digital Technology and Circuit Design
Premium
Stock market analysis displayed on world map with fluctuating candlestick chart indicating global finance trends and economic data visualized
Futuristic Digital Data Interface with Globe and Analytics
European Economic Trends in Digital Interface
Futuristic Data Processing with Graph and Network Visualization
Financial Data Analysis with Bitcoin Symbol on Futuristic Interface
Premium
Visualization of global trade routes highlighting economic connections across continents with a focus on Europe
Global Data Insights with Digital World Map and Floating Numbers
Futuristic Data Visualization with Graphs and Formulae Overlay
Global Digital Network with Data Processing Interface
Futuristic Digital Data Analysis with Holographic Graphs
Premium
Global metallic world map features increasing bar charts with dollar symbols showing rising numbers
Financial Data Processing Technology Over World Map
Global Stock Market Trends with Digital Earth Interface
Futuristic Digital Interface with Geometric Shapes and Data Elements
Dynamic Financial Graph and Data Visualization Concept
Premium
Global data visualization overlaying a world map.
Global Digital Data Visualization with Futuristic Interface
Digital Analysis Overlay with Map and Compass Elements
Global Technology Advancement Represented by Cogs World Map
Futuristic Virtual Data Dashboard with Analytics Interface Visualization
Global Economy and Data Processing Digital Interface
High-Tech Digital Interface Showing Data and Code
Premium
digital map of Europe showcasing social inequality through illuminated data points and connections, highlighting disparities across regions
Digital Compass Overlay on Dynamic Data Charts
Globe with Financial Data and Graphs in Futuristic Blue Theme
Global Digital Network with Earth and Data Interface Overlay
Digital Stock Market Data Trends on Blue Interface
Premium
Global Night Map with Green Financial Graph Overlay
Digital Analytics Spreadsheet with Pi Vorlage and Graph Elements
Global Connections with Circuit Design in Technology Sphere
Global Network Connectivity with Futuristic Graph Interface
Global Economic Growth Concept with Graph and Microprocessor
Premium
A colorful world map highlighting regions with varying temperatures, displayed in orange and red tones against a dark background.
Analyzing Statistics Over European Map
Digital Navigation Interface Displaying Global Coordinates
Rising Financial Graph with Dollar Symbol Futuristic Interface
Digital Fingerprint and Financial Data Interface Concept
Premium
Europe Population Density Map
Data Charts on Transparent Screen in Office Setting
Digital Data Visualization with Code and Analytical Charts
Futuristic Financial Analytics and Data with Digital Interfaces
Digital Data Visualization Over Globe with Technology Interface
Premium
Abstract 3D map of Europe with data points
Digital Data Overlaying Globe Illustrating Global Finance
Futuristic 5G Technology Network with Data Innovation
Global Financial Data Analysis with World Map and Graphs
Global Financial Data Processing on World Map
Premium
A futuristic visualization displays a digital world map with a magnifying glass focusing on Europe. Data points and graphics represent information analysis in a technology-driven environment
Futuristic Digital Interface with Chemical Formulas and Data Streams
Global Financial Data Analysis with Digital Coding Elements
Futuristic Data Dashboard with Holographic UI Components
Advanced Digital Interface with Data Analytics Overlaid on Network
European Union Flag Overlaid on Europe Map with Compass
Digital Protection Concept with 5G Network Integration
Premium
A digital map showing global renewable energy data, representing technology's role in tracking and optimizing energy resources.
Innovative Financial Data_analysis Keeping Track of Global Transactions
Futuristic Digital Interface with Data and Connections
Visualizing Data Analytics with Digital Interface Elements
Abstract Overlay of Financial Charts and Statistics
Premium
Close-up of male hands working with Europe sales statistic report. Caucasian businessman sitting at table and examining financial paper. Marketing concept
Global Stock Trends Surveillance Overlapping Technology Design
Dynamic Global Financial Graph with Technological Blueprint Overlay
Complex Financial Analytics and Data Visualization in Digital Space
Digital Data Visualization Overlaid on African Continent Map
Premium
European map shaded by a grayscale value
Glowing Financial Interface with Scanning Earth Overlay
Euro Currency Symbol with Rising Green Financial Graph
Digital Data Analysis with Graphs and Analytics Tools
Dynamic Data Minimalistic Futuristic Technology
Premium
business stock market graphs with a world economic map.
Financial Data Interfaces and Digital Analytics Concept
Financial Data Visualization with Cloudscape Background
Data Analytics Dashboard with Displayed Graphs and Statistics
Compass and European Map with Highlighted Stars for Travel Inspiration
Premium
Financial chart with moving up arrow graph and world map
Futuristic AI Brain with Speech Bubble and Data Visualizations
Digital Financial Chart with Stock Market Data and Analytics
Global Finance Data Visualization with World Map and Graphs
Data Analysis Concept with Circular Scanner and Financial Charts
Premium
Global economic growth concept with a world globe and rising bar graph with arrow pointing upward, symbolizing progress and financial success
Futuristic Dashboard with Rotating Digital World Map Interface
Futuristic Digital Interface with Chart and Data Visualizations
Financial Analysis Charts Data With Global Business Stats
European Union Flag Over Map with Compass Symbol
Euro Currency Symbol with Digital Finance Infographic
Navigating Digital Networks with Overlaid Question Marks
Premium
Financial data and graph image over digital map of Europe and Africa
Futuristic Digital Display with Code and Holographic Graphics
Digital Financial Chart Analysis Background
Digital Data Processing and Cityscape Overlay Background
Global Technology Interface Concept with Globe and Circuit Blueprint
Premium
Gray Scale Map of Europe Showing Different Regions and Countries
Global Graph Trends on Digital Interface Concept
Global Stock Market and Digital Data Mix
Abstract Digital Interface with Financial Data Overlay
Digital Map of Europe with Data Overlay and Technology Themes
Premium
Digital world map with financial data visualization, market trends and analytics. vibrant colors and intricate details create dynamic representation of global finance
Global Financial Data Visualized on Digital Network Interface
Stock Market Data Overlay Pi Symbol Background
Digital Financial Data on Grid
Digital Analysis of Concept of Time with Data Code in Background
Premium
A digital map of Europe with glowing orange data visualizations overlayed
Innovative 5G Network Technology with Digital Interface
Global Finance Data Visualization with World Map Background
Global Business Transformation with Digital Interface Technologies
Financial Data and Analytics Visualization in Digital Interface
Premium
A close-up view of a illuminated map of Europe, showcasing vibrant orange points that represent locations or data points across the continent.
Digital Interface with Global Business Analysis
Abstract Digital Interface with Global Data Visualization
Global Data Analysis with Geographical and Digital Insights
Futuristic Financial Data Analysis with Digital Charts and Graphs
Premium
Healthcare professional using digital tablet to visualize global health data in a modern medical setting
Holographic Earth with Financial Charts and Candlestick Graphs Visualizing Global Market Analytics