1. Home > 
  2. Stock Photos > 
  3. Data Analysis and Visualization on Gradient Background

Data Analysis and Visualization on Gradient Background Image

Data Analysis and Visualization on Gradient Background

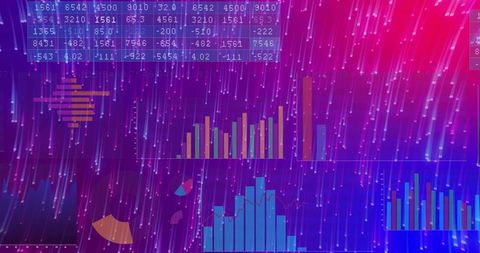
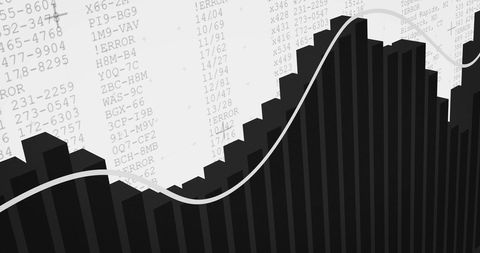
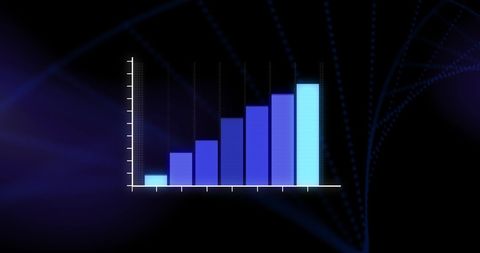
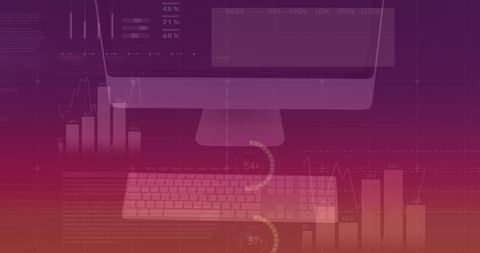
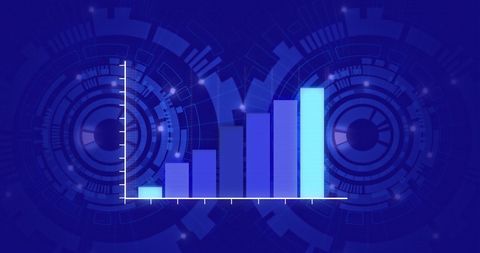
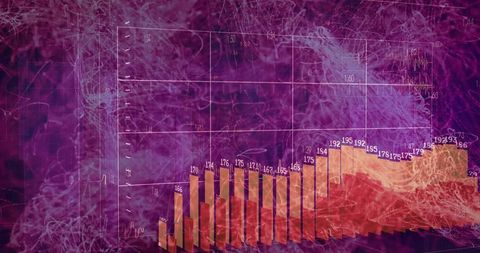
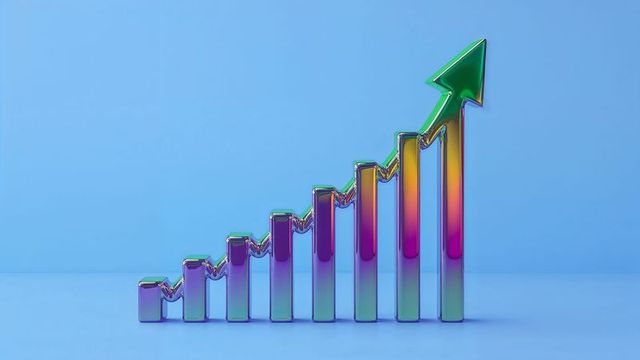
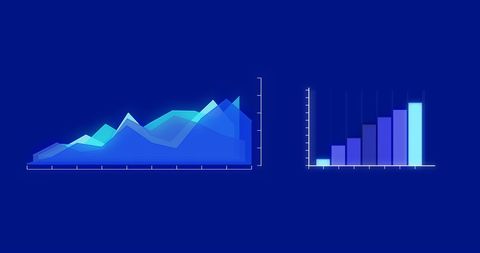
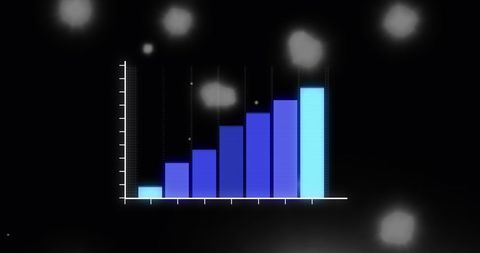
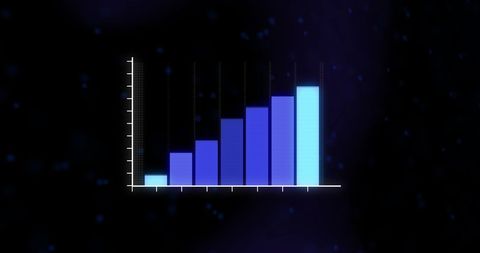
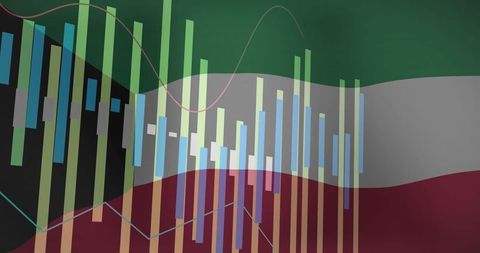
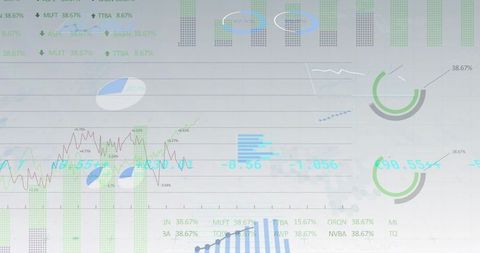
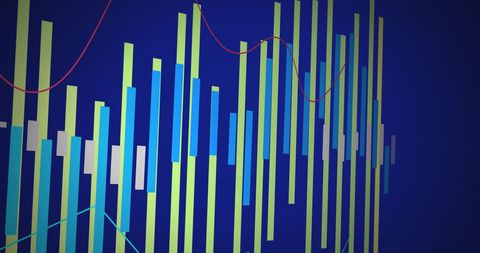
Abstract illustration showcasing data analysis and visualization against a vivid purple gradient background. The bar graph reveals trends or statistics, suitable for presentations on finance, global business, or technology. Ideal for demonstrating digital interfaces, reporting tools, or showcasing connections in a data-driven environment.

Powered by Shutterstock logo - Get 15% off with code: PIKWIZARD15
Displaying dashboard showing pie, bar, line and candlestick charts with percentage labels on screen. Futuristic, analytics, technology, innovation, data, interface, visualization - Powered by Shutterstock - Get 15% off with code: PIKWIZARD15Image of financial data processing over purple shapes on black background. Finances, business, computing and digital interface concept digitally generated image. - Powered by Shutterstock - Get 15% off with code: PIKWIZARD15Dynamic digital equalizer and waveform display on a dark background, illustrating audio processing, sound visualization, or data analysis with glowing lines and abstract patterns. - Powered by Shutterstock - Get 15% off with code: PIKWIZARD15Man touches phone in virtual space. Concept of social media marketing, internet advertisement, e-commerce, global internet, network connection, new feedback, reply chat and smm strategy. - Powered by Shutterstock - Get 15% off with code: PIKWIZARD15Showing green candlestick chart purple line graph in data UI, numeric grid labels, network sphere. Data analysis, visualization, digital interface, financial technology, scientific research, - Powered by Shutterstock - Get 15% off with code: PIKWIZARD15

Credit Photo

If you would like to credit the Photo, here are some ways you can do so

Free (free of charge)

Free for personal and commercial use.

Author: People Creations

Similar Free Stock Images

Visual Data Charts Representing Financial Analytics
Premium
Image of data processing over purple digital wave against purple background. Computer interface and business technology concept
Dynamic Data Visualization on Digital Interface
Premium
Blurred background of innovative laboratory environment showcasing advanced monitors displaying data analysis. a clean, organized workspace designed for scientific research and experimentation.
Premium
African American man smiles widely as facial recognition software analyzes his features among vibrant purple hues.
Glowing Blue Bar Chart on Futuristic Digital Background
Dynamic Vertical Bar Chart with Trend Lines on Dashboard
Innovative Data Visualization in Digital Interface
Abstract Financial Charts with Graphs and Data Visualization
Professional Businesswoman Analyzing Data in Modern Office
Abstract Data Analysis with USA Theme Overlay
Digital Financial Analytics Dashboard with Data Visualization
Abstract Data Visualization with Graphs on Purple Background
AI
Futuristic Iridescent Bar Chart with Green Arrow on Blue Background
Abstract Financial Data Error Bar Graph Concept
Abstract Financial Data with White Graph Against Dark Blue Background
Financial Data Analysis and Decline Interpretation
Premium
Futuristic Data Visualization Stage with Holographic Displays.
Premium
Blurred background of a visually striking workspace featuring multiple monitors displaying vibrant codes and data analysis under a neon glow, perfect for tech enthusiasts and professionals.
Global Finance Data Visualization with Business Professionals
Data-Driven Insights Unfold as Businessman Analyzes Financial Trends
Dynamic Data Visualization on Vibrant Purple Background
Data Analysis Interface with Charts and Statistics on Digital Screen
Premium
Purple strands image over dark gradient background. genetics, biotechnology, molecular, science, research, helix
Digital Data Processing with Global Technology Interface Design
Digital Data Analytics Dashboard with Interactive Graphs and Charts
AI
Minimalist Computer Monitor with Gradient Background
Abstract Digital Data Bars with Colorful Lines on Blue
Bar Chart and Line Graph with Digital Globe and Network Connections
Neon 3D Financial Bar Chart Rising Overlaid with Grid Lines and Abstract Smoke
Abstract Blue Data Charts on Dark Gray Background
Digital Transformation with Data and DNA
Futuristic 3D Data Visualization with Coding Elements
Abstract Financial Chart with Bar Graph and Line Design
Futuristic Digital Interface with Dynamic Graphs and Data
Digital Financial Data Analysis with Graph Overlay
Colorful Books with 2nd January Text Celebration
Premium
Heatmap of city with glowing orange and purple lights showing urban activity. Illuminating population density and traffic flow. Houston at night. Elements of this image furnished by NASA
Growing Bar Graph and Digital Data Theme
Premium
Displaying candlestick chart bars and purple dotted trend arrow on data interface, with world map. Finance, data visualization, digital interface, analytics, technology, innovation, business
Abstract Bar Graph with Wave Line on Tech Background
Financial Graphs with Blue Bars and Red Overlay Illustrations
Colorful Abstract Graphs and Charts for Data Analysis and Presentation
Financial Data Visualization on Cityscape Background
Financial Data Visualization Analysis on Black Background
Dynamic Financial Dashboard with Bar Charts and Graphs
Colorful Bar Charts and Arrows on Vivid Red Background
Premium
Blurred Background of Modern Data Center with Futuristic Design, High-Tech Workstations, and Colorful LED Screens Featuring Digital Graphics and Data Visualization
Abstract Data Analysis with Graphs and Figures
Financial Data Graphs Show Income and Tax Trends
Digital Bar Graph with Futuristic Interface Theme
Animating Neon Data Dashboard with Falling Light Trails, Bar Charts, Numeric Matrix
Premium
Scientist analyzing data visualization of sound waves in futuristic lab setting.
Futuristic Data Visualization World Map with Digital Dashboard
Three Kings Day Celebration Banner with Candles and Star Decorations
Businesswoman Uses Tablet with Animated Data Visualizations in Modern Office
Abstract Colorful Bar Graph on Red Background
Premium
Floating holographic rings displaying bar chart line graph in fenced hall with magenta indicators. Futuristic, technology, data, analysis, industrial, visualization, cybersecurity
Digital Financial Data Visualization with Bar and Line Graph
Dynamic Digital Financial Data Visualization on Dark Background
Abstract Data Visualization on Red Background
Financial Data Processing Over Black Background with Error Messages
Premium
Image of financial data processing over purple spots on black background. Finances, business, computing and digital interface concept digitally generated image.
3D Graph with Arrow Showing Upward Business Trend
Eco Network and Data Processing with Digital Graphics
Premium
A smiling young man displays a digital overlay of facial recognition technology on his face. The vibrant purple background enhances the futuristic theme of the moment.
Financial Data Analysis with Currency Insights
Futuristic Data Visualization with Graphs and Gauges
Digital Data Graph with Code Interface on Blue Background
Abstract Digital Data Processing on Gradient Background
Premium
Architecture texture and background with green, blue and purple neon lights. Data visualization. IT technology texture and backdrop.
Happy Substitute Day Greeting with Colorful Books
Premium
Displaying combined bar and line chart on digital dashboard, with vertical bars and trend line. Data analysis, analytics, dashboard, infographics, visualization, technology, modern
Business Chart with Declining Graph and Red Arrow
Digital Analytics Overlaying Chinese Flag Symbolizing Economy Trends
Overlay of Infographic Interface on Business Desktop
Premium
Showing malware overlay merging with sea, with pie and line graphs percentages and binary code. Cyberspace, data visualization, technology, digital, network security, data analysis, abstract
Futuristic Data Analysis with Bar Graphs and Charts Overlay
Digital Interface with Global Data Charts
Colorful Bar Graph with Data Overlay on Black Background
Abstract Financial Data Analysis on Blue Background
Financial Data Processing with Global Currency Indicators
Digital Bar Graph with Blue Data Visualization
Futuristic Data Analytics Interface with Bar Graph and Waveform
Abstract Data Visualization with Growing Charts
Premium
Displaying digital world map on dark grid plane, with bars, pie and donut charts, numeric labels. Data visualization, technology, futuristic, information, infographic, analysis, digital
Abstract Data Visualization with Graphs and Charts
Financial Data Processing in Digital Global Interface Concept
Digital Charts on Dark Background Highlighting Data Analytics
Financial Data Analysis with Abstract Graphs
Premium
Abstract water splash.Big data. Cyber or technology background. Neon flare. 3D rendering.
Digital Financial Data and Market Trends Analysis on Black Background
Abstract Financial Data with Bar Graph Overlay
Financial Data Analysis with Bar Chart
Global Currency Charts Displaying Market Fluctuations
Economic Decline Amid Global Crisis Showcasing International Politics
Data Analysis and Global Business Conceptual Illustration
3D Bar Graph on Digital Interface with Glowing Elements
Increasing Data Bar Chart on Gradient Background
Analysts Collaborate on Innovative Data Analytics in Modern Office
Financial Data Processing on Grey Digital Background
Dynamic Digital Financial Analysis with 3D Graphics
Digital Graphs on Blue Background Illustrating Financial Data
Futuristic Data Analytics with Bar Graph and Blue Technology Background
Financial Data Analysis with Code and Graphics
Premium
Black pen and white pen on paper with blue bar chart and wooden edge on purple background
Premium
Time management and research. Young woman holding clock and magnifying glass over gradient purple background in neon light. Concept of business, modern technologies, innovations
Digital Data Processing with Binary Code and Bar Graph
Premium
Hand holds phone with data visualization in futuristic tech lab.
Digital Financial Bar Graph on Black Background
Graph with Data Background Highlighting Market Trends
Abstract Financial Analytics with Digital Binary Code Integration
Financial Data Trend Analysis with Graphs on Green Background
Premium
Displaying futuristic dashboard interface showing line chart and pixelated globe at virtual panel. Technology, innovation, data analysis, ui design, cyber, analytics, digital
Colorful Data Charts with Arrows on Red Background
Abstract Data Analysis on Kuwaiti Flag Background
Financial Market Analysis Graph with Currency Exchange
Black Bar Graph and Line Chart on White Background
Premium
Displaying line chart at trading screen with purple, red-striped arrows marking 73.55 and 50.05. Financial analytics, data visualization, trading interface, investment, digital dashboard
Digital Financial Data Infographic on Blue Background
Digital Data Graph Overlaying Urban Cityscape
Dynamic Stock Market Data with Engineer in High-Tech Server Room
Premium
A close-up view of a person's hands typing on a keyboard in a dark environment, surrounded by glowing icons and graphics that represent essential cybersecurity concepts and data analysis.
Premium
Blurred background of a modern office space bathed in neon colors, featuring multiple computer screens displaying data visualizations, perfect for themes of technology and innovation.
Abstract Financial Data Background with Dynamic Charts
Explore More Free Stock Images