- Home >
- Stock Photos >
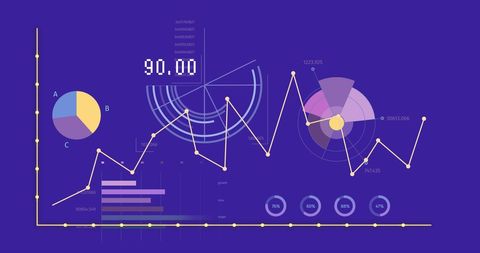
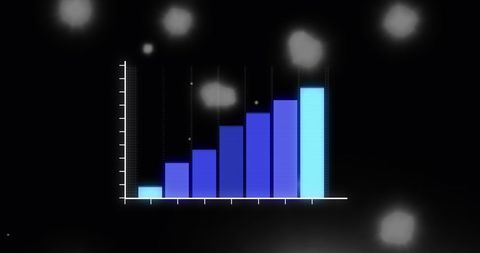
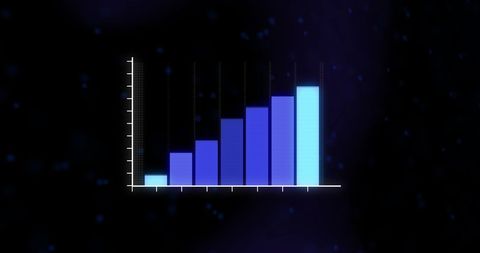
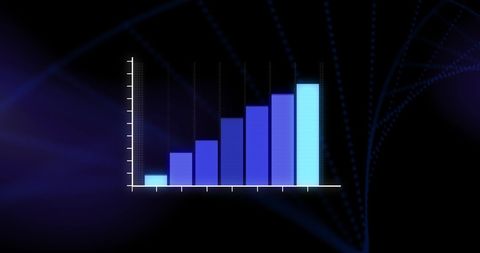
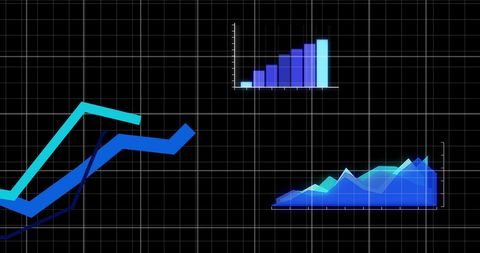
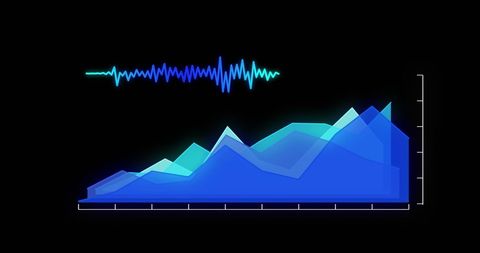
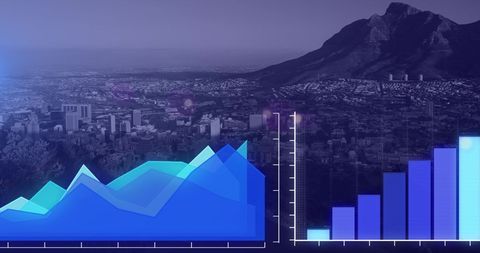
- Data Analysis Background with Bar and Line Graphs
Data Analysis Background with Bar and Line Graphs Image

Stylized depiction of data analysis featuring bar and line graphs on blue background. Digital icons represent technology and connectivity themes, ideal for illustrating data-driven articles, technology blogs, business reports, and educational content focusing on data science or statistical analysis.

downloads
Tags:
More
Credit Photo
If you would like to credit the Photo, here are some ways you can do so
Text Link
photo Link
<span class="text-link">
<span>
<a target="_blank" href=https://pikwizard.com/photo/data-analysis-background-with-bar-and-line-graphs/5b4739085c643ddb959426958ff49fb3/>PikWizard</a>
</span>
</span>
<span class="image-link">
<span
style="margin: 0 0 20px 0; display: inline-block; vertical-align: middle; width: 100%;"
>
<a
target="_blank"
href="https://pikwizard.com/photo/data-analysis-background-with-bar-and-line-graphs/5b4739085c643ddb959426958ff49fb3/"
style="text-decoration: none; font-size: 10px; margin: 0;"
>
<img src="https://pikwizard.com/pw/medium/5b4739085c643ddb959426958ff49fb3.jpg" style="margin: 0; width: 100%;" alt="" />
<p style="font-size: 12px; margin: 0;">PikWizard</p>
</a>
</span>
</span>
Free (free of charge)
Free for personal and commercial use.
Author: People Creations