
- Home >
- Stock Photos >
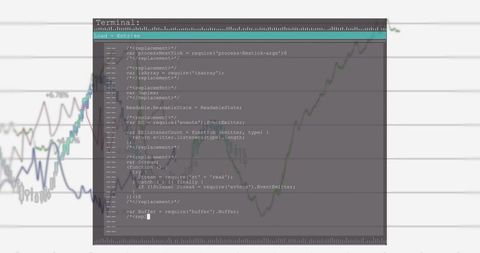
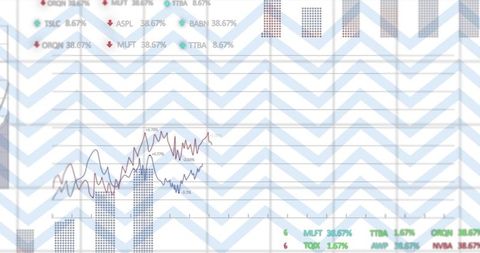
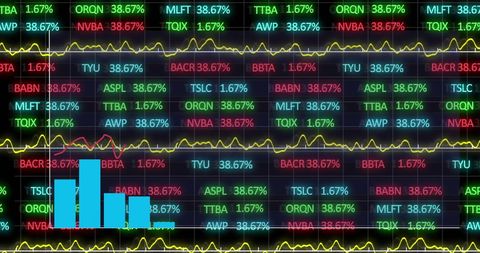
- Data Analysis Charts and Graphs on Digital Interface
Data Analysis Charts and Graphs on Digital Interface Image

Visual showcasing digital charts and graphs, representing data analysis and statistics on a white background. Can be used by businesses and finance professionals to illustrate analytics concepts. Appropriate for technology-oriented presentations and educational materials focusing on data and statistical interpretation.
Powered by 


downloads
Tags:
More
Credit Photo
If you would like to credit the Photo, here are some ways you can do so
Text Link
photo Link
<span class="text-link">
<span>
<a target="_blank" href=https://pikwizard.com/photo/data-analysis-charts-and-graphs-on-digital-interface/6689e0643be85e1668618e03d54408a7/>PikWizard</a>
</span>
</span>
<span class="image-link">
<span
style="margin: 0 0 20px 0; display: inline-block; vertical-align: middle; width: 100%;"
>
<a
target="_blank"
href="https://pikwizard.com/photo/data-analysis-charts-and-graphs-on-digital-interface/6689e0643be85e1668618e03d54408a7/"
style="text-decoration: none; font-size: 10px; margin: 0;"
>
<img src="https://pikwizard.com/pw/medium/6689e0643be85e1668618e03d54408a7.jpg" style="margin: 0; width: 100%;" alt="" />
<p style="font-size: 12px; margin: 0;">PikWizard</p>
</a>
</span>
</span>
Free (free of charge)
Free for personal and commercial use.
Author: Authentic Images
Similar Free Stock Images

Premium


Premium


Premium

Premium

Premium


Premium


Premium


Premium

Premium


Premium


Premium


Premium


Premium


Premium


Premium


Premium


Premium


Premium

Premium


Premium


Premium


Premium


Premium

Premium


Premium


Explore More Free Stock Images