
- Home >
- Stock Photos >
- Data Analysis Concept with Graphs and Stools
Data Analysis Concept with Graphs and Stools Image

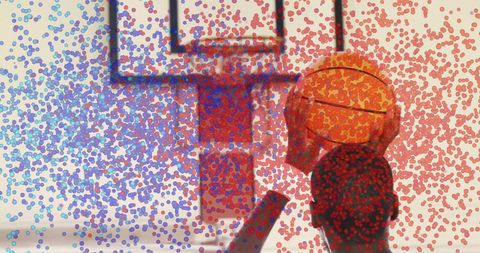
An abstract representation combining elements like graphs, percentages, and charts overlaying a stool and bucket with a blue background, signifying digital interfaces in data analysis. This visual design is suited for themes involving business analytics, digital technology inspiration, modern finance projects, market research presentations, or reports focused on data-driven decision-making processes.
Powered by 


downloads
Tags:
More
Credit Photo
If you would like to credit the Photo, here are some ways you can do so
Text Link
photo Link
<span class="text-link">
<span>
<a target="_blank" href=https://pikwizard.com/photo/data-analysis-concept-with-graphs-and-stools/ef88f774586a9ec4dd0e96daae4ab0c7/>PikWizard</a>
</span>
</span>
<span class="image-link">
<span
style="margin: 0 0 20px 0; display: inline-block; vertical-align: middle; width: 100%;"
>
<a
target="_blank"
href="https://pikwizard.com/photo/data-analysis-concept-with-graphs-and-stools/ef88f774586a9ec4dd0e96daae4ab0c7/"
style="text-decoration: none; font-size: 10px; margin: 0;"
>
<img src="https://pikwizard.com/pw/medium/ef88f774586a9ec4dd0e96daae4ab0c7.jpg" style="margin: 0; width: 100%;" alt="" />
<p style="font-size: 12px; margin: 0;">PikWizard</p>
</a>
</span>
</span>
Free (free of charge)
Free for personal and commercial use.
Author: Awesome Content
Similar Free Stock Images

Premium


Premium


Premium


Premium

Premium


Premium


Premium


Premium


AI


Premium


Premium

AI


AI

Premium


Premium


Premium

Premium


Premium


Premium


Premium

AI


Premium

Premium


Premium


Premium

AI


AI


Premium


Premium


AI


Premium


Premium


Explore More Free Stock Images