- Home >
- Stock Photos >
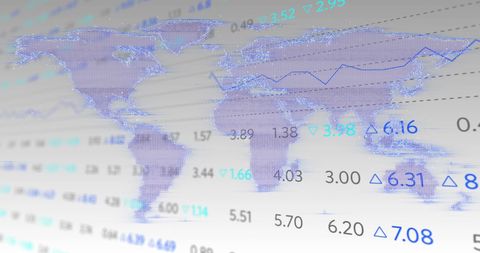
- Data Analysis Graphics on World Map Background
Data Analysis Graphics on World Map Background Image

Graphic depicting data and statistics overlay on world map signifies global business insights and economic analysis. Useful for illustrating concepts in international finance, market trends analysis, innovation in digital trading platforms, and educational materials on global statistics.

downloads
Tags:
More
Credit Photo
If you would like to credit the Photo, here are some ways you can do so
Text Link
photo Link
<span class="text-link">
<span>
<a target="_blank" href=https://pikwizard.com/photo/data-analysis-graphics-on-world-map-background/1408585595a7edd484d37d8e216ad5d7/>PikWizard</a>
</span>
</span>
<span class="image-link">
<span
style="margin: 0 0 20px 0; display: inline-block; vertical-align: middle; width: 100%;"
>
<a
target="_blank"
href="https://pikwizard.com/photo/data-analysis-graphics-on-world-map-background/1408585595a7edd484d37d8e216ad5d7/"
style="text-decoration: none; font-size: 10px; margin: 0;"
>
<img src="https://pikwizard.com/pw/medium/1408585595a7edd484d37d8e216ad5d7.jpg" style="margin: 0; width: 100%;" alt="" />
<p style="font-size: 12px; margin: 0;">PikWizard</p>
</a>
</span>
</span>
Free (free of charge)
Free for personal and commercial use.
Author: Awesome Content