
- Home >
- Stock Photos >
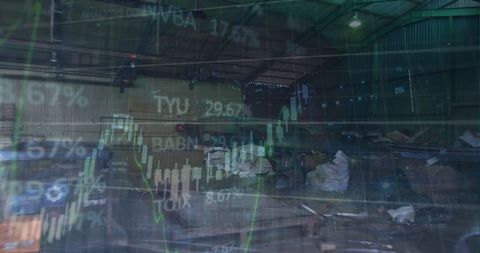
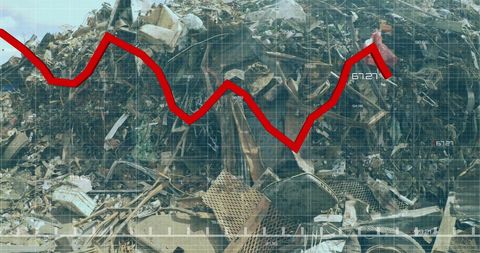
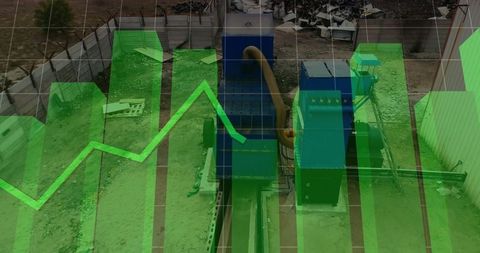
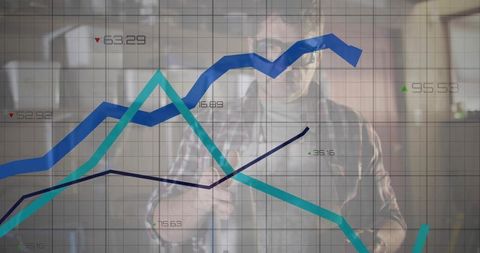
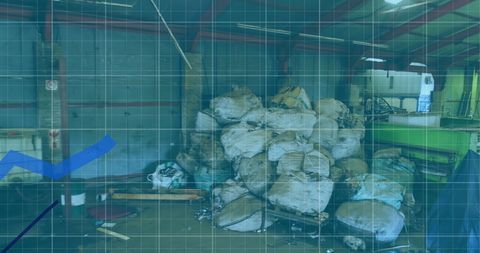
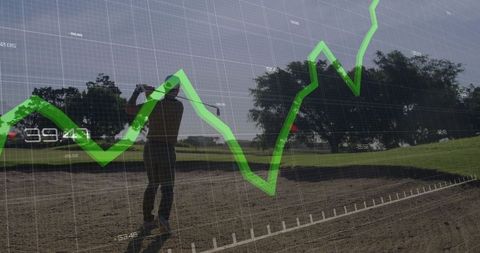
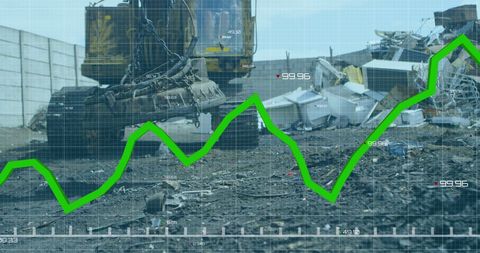
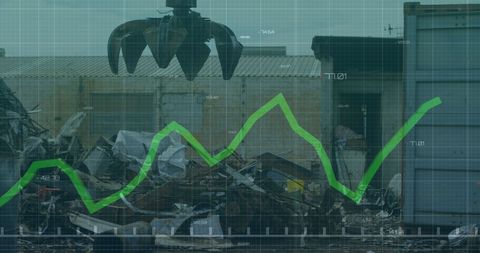
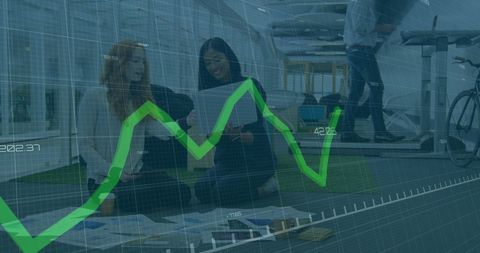
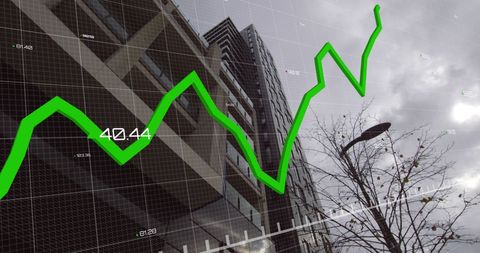
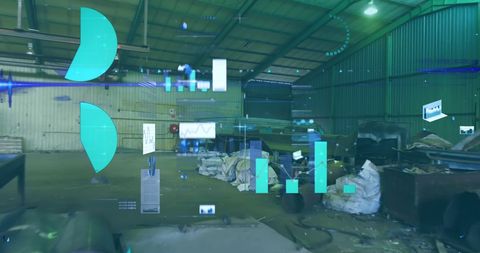
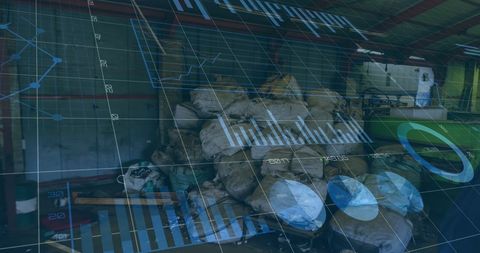
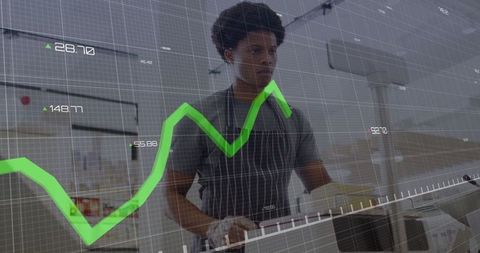
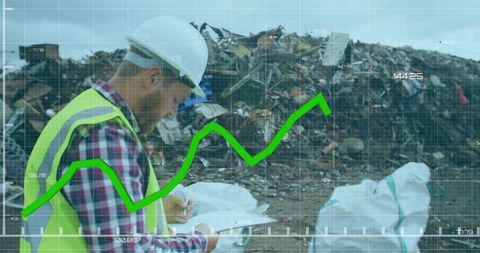
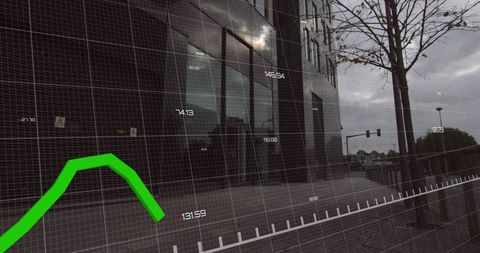
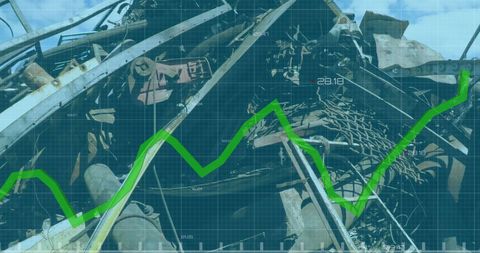
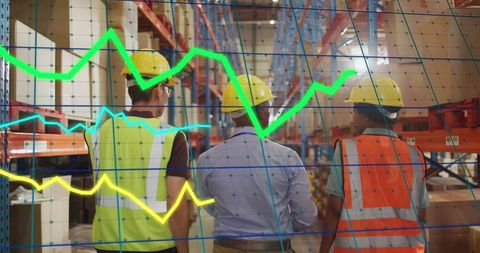
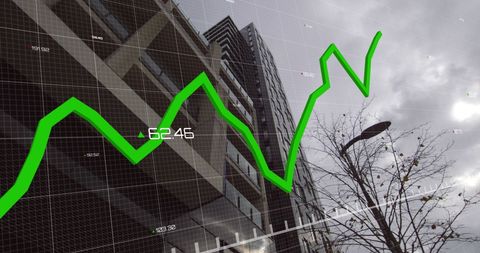
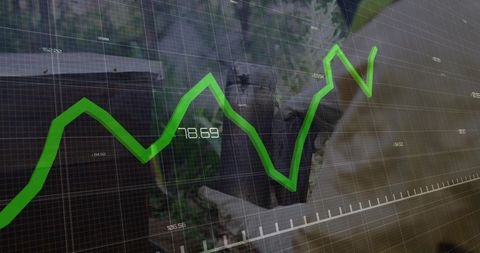
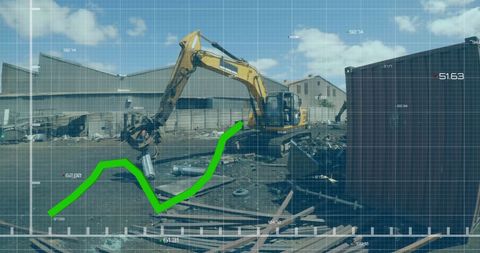
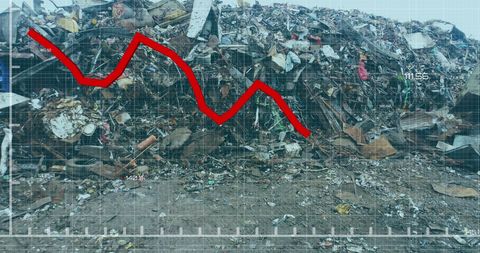
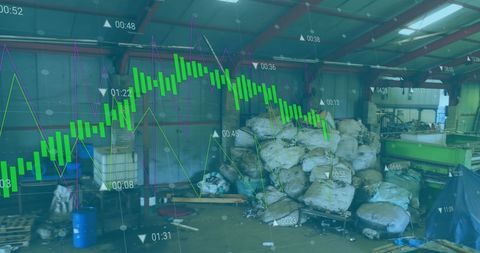
- Data Analysis in Waste Management Facility
Data Analysis in Waste Management Facility Image
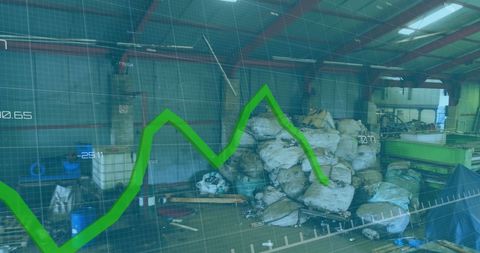
Scene showing the integration of data processing within a waste management facility emphasizes the importance of technological advancements in sustainability. Suitable for topics relating to environmental tech advancements, industrial efficiency improvements or technological innovation within the recycling industry.
Powered by 


downloads
Tags:
More
Credit Photo
If you would like to credit the Photo, here are some ways you can do so
Text Link
photo Link
<span class="text-link">
<span>
<a target="_blank" href=https://pikwizard.com/photo/data-analysis-in-waste-management-facility/ebdb59bb7f1fb79512a898819d2db6f1/>PikWizard</a>
</span>
</span>
<span class="image-link">
<span
style="margin: 0 0 20px 0; display: inline-block; vertical-align: middle; width: 100%;"
>
<a
target="_blank"
href="https://pikwizard.com/photo/data-analysis-in-waste-management-facility/ebdb59bb7f1fb79512a898819d2db6f1/"
style="text-decoration: none; font-size: 10px; margin: 0;"
>
<img src="https://pikwizard.com/pw/medium/ebdb59bb7f1fb79512a898819d2db6f1.jpg" style="margin: 0; width: 100%;" alt="" />
<p style="font-size: 12px; margin: 0;">PikWizard</p>
</a>
</span>
</span>
Free (free of charge)
Free for personal and commercial use.
Author: Authentic Images
Similar Free Stock Images
Premium
Premium

Premium


Premium


Premium

Premium


Premium


Premium


Premium

Premium


Premium


Premium


Premium


Premium

Premium


Premium


Premium


Premium


Premium


Premium

Premium

Premium


Premium


Premium


Premium


Explore More Free Stock Images