
- Home >
- Stock Photos >
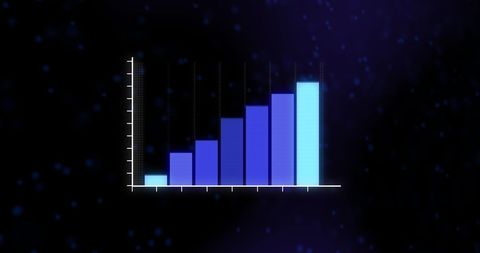
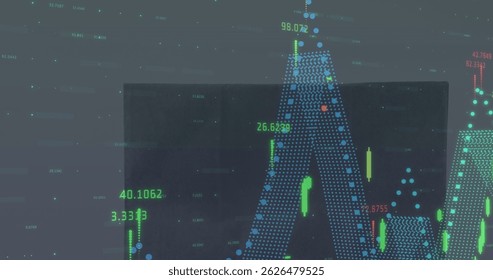
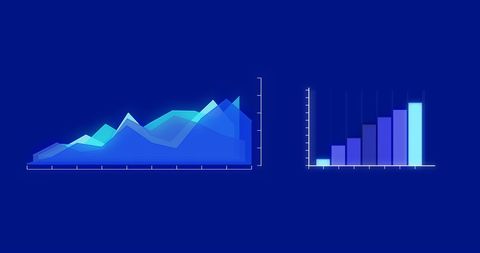
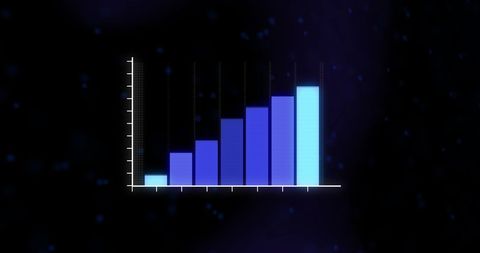
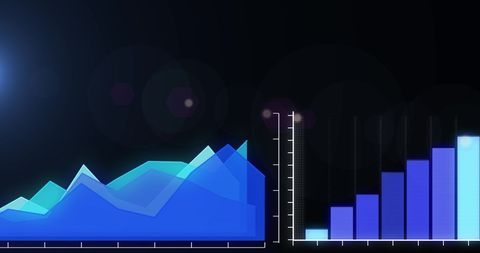
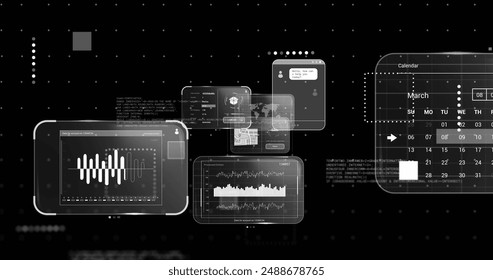
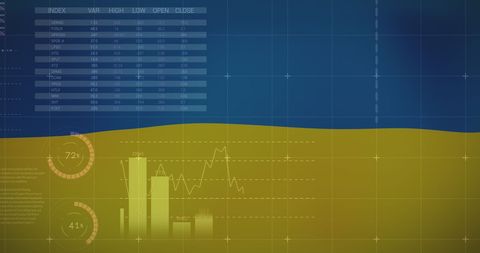
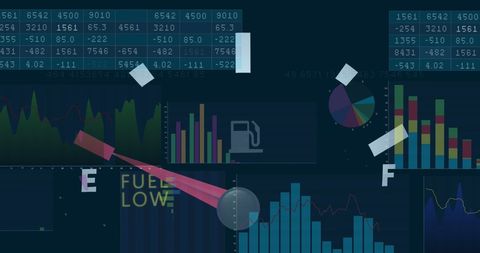
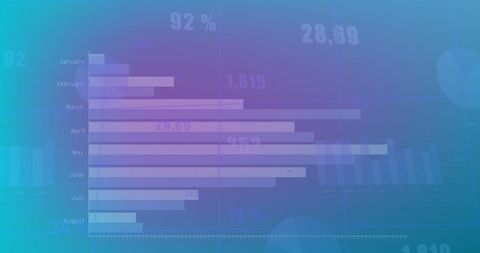
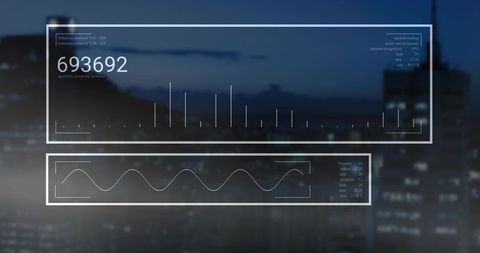
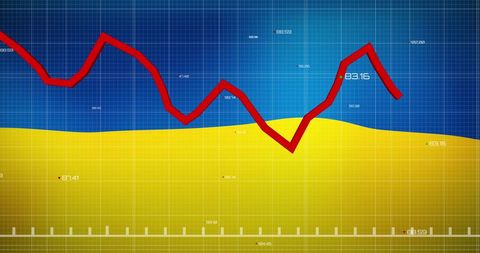
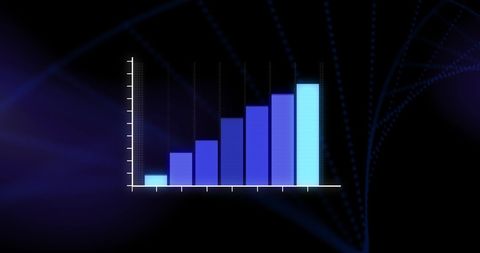
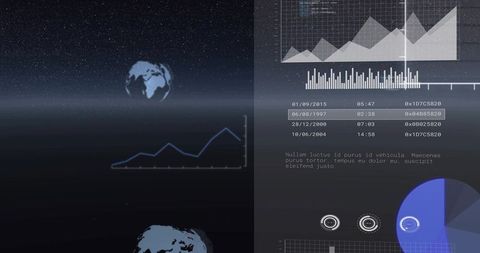
- Data Analysis Interface with Charts and Statistics on Digital Screen
Data Analysis Interface with Charts and Statistics on Digital Screen Image

Futuristic digital display illustrating data processing through financial charts and graphs. This high-tech visualization of data is ideal for use in presentations about financial analysis, business intelligence, data management, and technology trends.
Powered by  - Get 15% off with code: PIKWIZARD15


downloads
Tags:
More
Credit Photo
If you would like to credit the Photo, here are some ways you can do so
Text Link
photo Link
<span class="text-link">
<span>
<a target="_blank" href=https://pikwizard.com/photo/data-analysis-interface-with-charts-and-statistics-on-digital-screen/ba30b92b91c649393625ab246868e0cb/>PikWizard</a>
</span>
</span>
<span class="image-link">
<span
style="margin: 0 0 20px 0; display: inline-block; vertical-align: middle; width: 100%;"
>
<a
target="_blank"
href="https://pikwizard.com/photo/data-analysis-interface-with-charts-and-statistics-on-digital-screen/ba30b92b91c649393625ab246868e0cb/"
style="text-decoration: none; font-size: 10px; margin: 0;"
>
<img src="https://pikwizard.com/pw/medium/ba30b92b91c649393625ab246868e0cb.jpg" style="margin: 0; width: 100%;" alt="" />
<p style="font-size: 12px; margin: 0;">PikWizard</p>
</a>
</span>
</span>
Free (free of charge)
Free for personal and commercial use.
Author: People Creations
Similar Free Stock Images

Premium


Premium


Premium


Premium


Premium


Premium


Premium


Premium
Premium


Premium


Premium


Premium


Premium


Premium


Premium

Premium


Premium


Premium


Premium


Premium

Premium


Premium


Premium


Premium


Premium


Explore More Free Stock Images