- Home >
- Stock Photos >
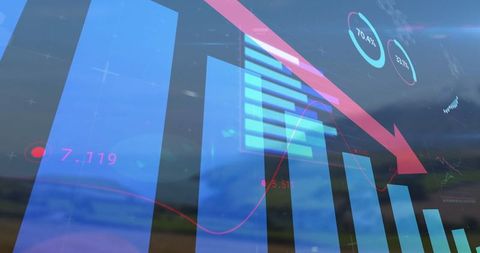
- Data Analysis Interface with Graph and Descending Trend Arrow
Data Analysis Interface with Graph and Descending Trend Arrow Image

Conceptual illustration showcasing data processing with graphs and a prominent descending red arrow, indicating a decrease or negative trend. Suitable for presentations on finance, economic analysis, risk management, or technological advancements in data analytics. Ideal for business-related blogs and technological content handling data trends and research reports.
Powered by 


downloads
Tags:
More
Credit Photo
If you would like to credit the Photo, here are some ways you can do so
Text Link
photo Link
<span class="text-link">
<span>
<a target="_blank" href=https://pikwizard.com/photo/data-analysis-interface-with-graph-and-descending-trend-arrow/12e04018fbc21bf8d0922378e92bdc72/>PikWizard</a>
</span>
</span>
<span class="image-link">
<span
style="margin: 0 0 20px 0; display: inline-block; vertical-align: middle; width: 100%;"
>
<a
target="_blank"
href="https://pikwizard.com/photo/data-analysis-interface-with-graph-and-descending-trend-arrow/12e04018fbc21bf8d0922378e92bdc72/"
style="text-decoration: none; font-size: 10px; margin: 0;"
>
<img src="https://pikwizard.com/pw/medium/12e04018fbc21bf8d0922378e92bdc72.jpg" style="margin: 0; width: 100%;" alt="" />
<p style="font-size: 12px; margin: 0;">PikWizard</p>
</a>
</span>
</span>
Free (free of charge)
Free for personal and commercial use.
Author: Awesome Content