
- Home >
- Stock Photos >
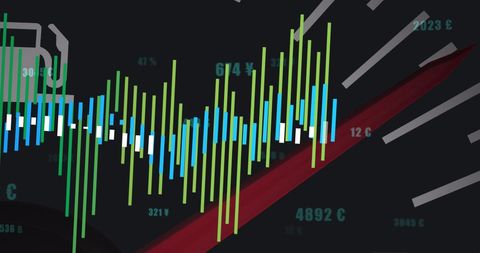
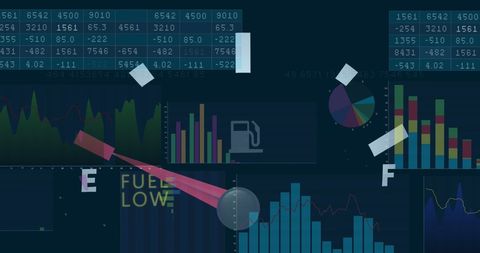
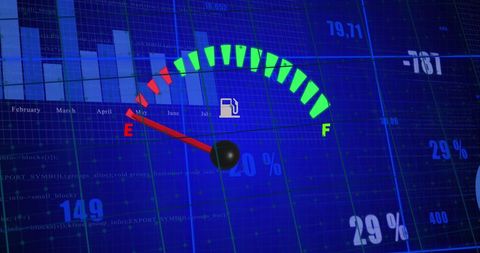
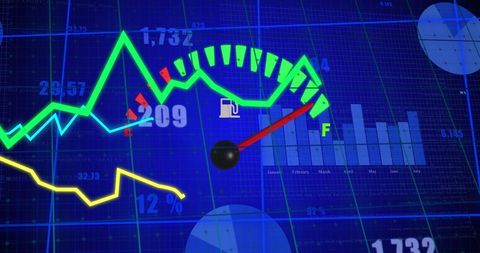
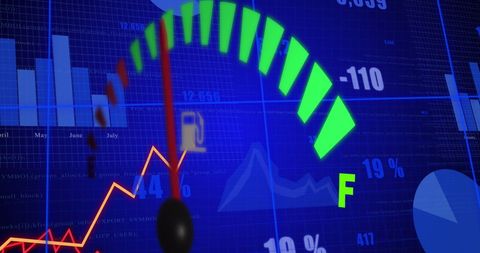
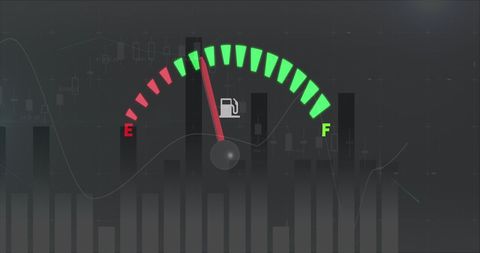
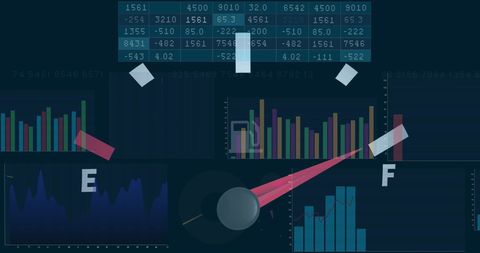
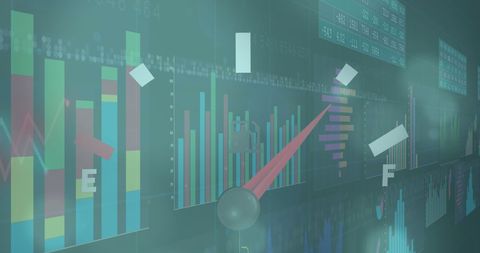
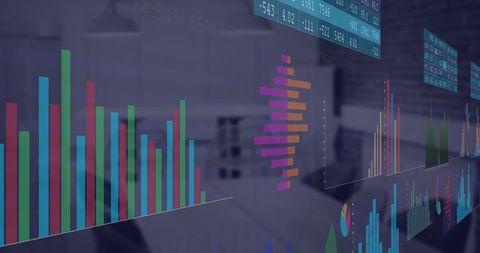
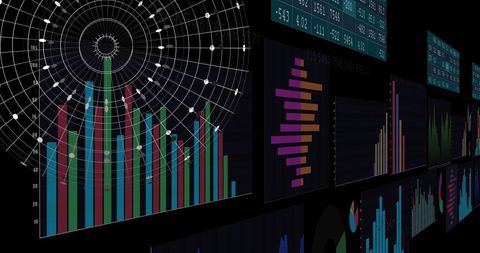
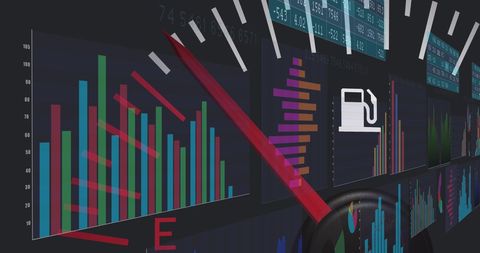
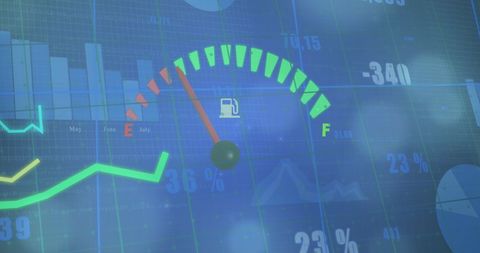
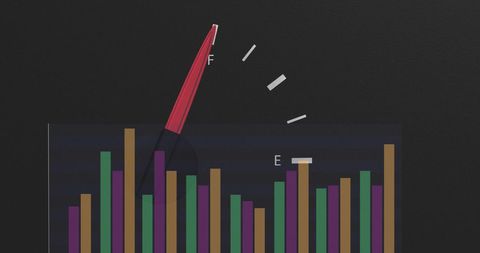
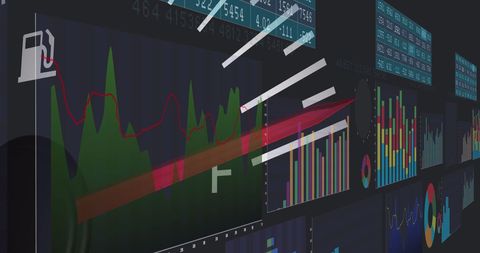
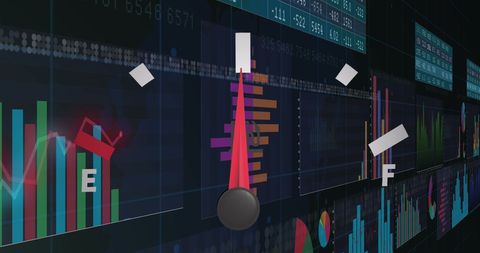
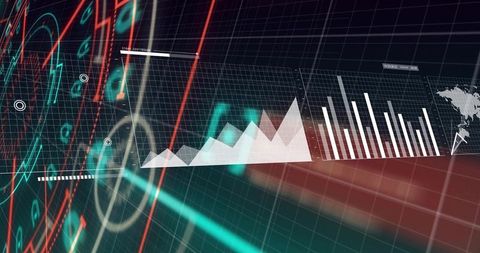
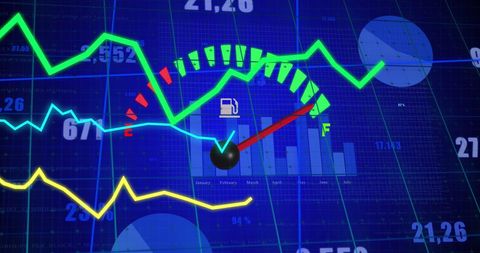
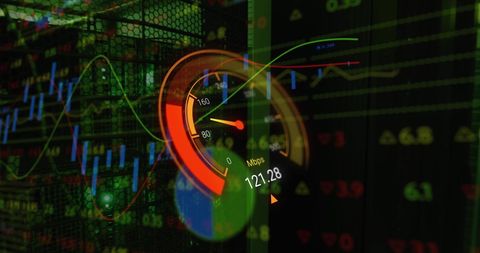
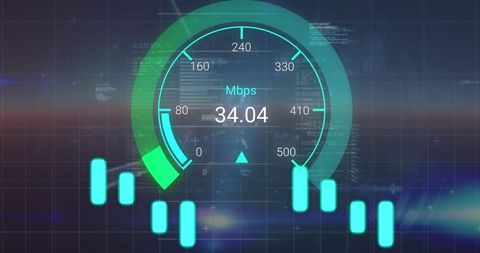
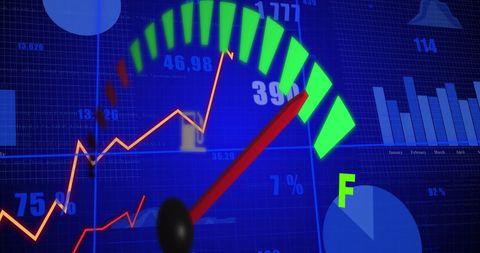
- Data Analysis on Fuel Gauge Concept Background
Data Analysis on Fuel Gauge Concept Background Image

This illustration combines data analysis elements like graphs and charts with a fuel gauge concept. Useful for metaphors involving energy, resources in business analytics, or comparing data insights to fuel levels. Ideal for business presentations, finance seminars, or articles relating data processing to practical scenarios.
Powered by 


downloads
Tags:
More
Credit Photo
If you would like to credit the Photo, here are some ways you can do so
Text Link
photo Link
<span class="text-link">
<span>
<a target="_blank" href=https://pikwizard.com/photo/data-analysis-on-fuel-gauge-concept-background/3f09cbb1973a62f070b366334bfa6b85/>PikWizard</a>
</span>
</span>
<span class="image-link">
<span
style="margin: 0 0 20px 0; display: inline-block; vertical-align: middle; width: 100%;"
>
<a
target="_blank"
href="https://pikwizard.com/photo/data-analysis-on-fuel-gauge-concept-background/3f09cbb1973a62f070b366334bfa6b85/"
style="text-decoration: none; font-size: 10px; margin: 0;"
>
<img src="https://pikwizard.com/pw/medium/3f09cbb1973a62f070b366334bfa6b85.jpg" style="margin: 0; width: 100%;" alt="" />
<p style="font-size: 12px; margin: 0;">PikWizard</p>
</a>
</span>
</span>
Free (free of charge)
Free for personal and commercial use.
Author: Authentic Images
Similar Free Stock Images

Premium


Premium


Premium


Explore More Free Stock Images