
- Home >
- Stock Photos >
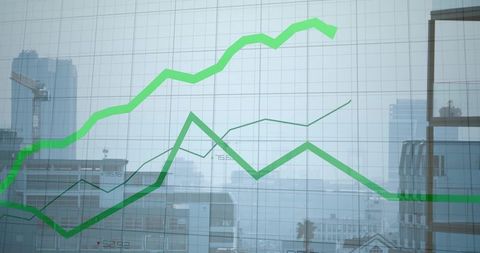
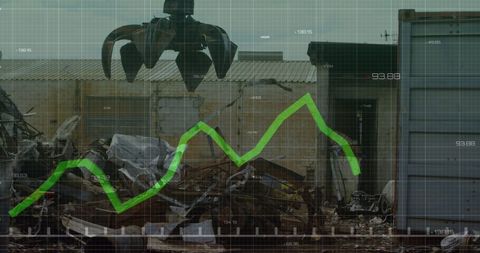
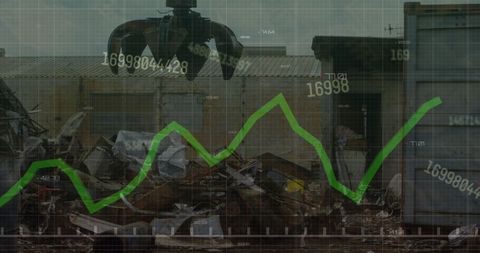
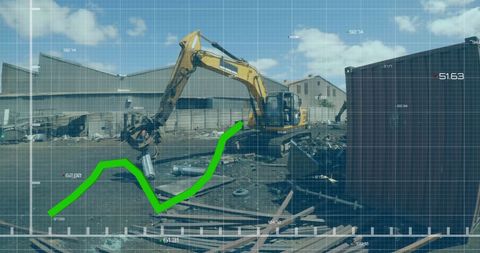
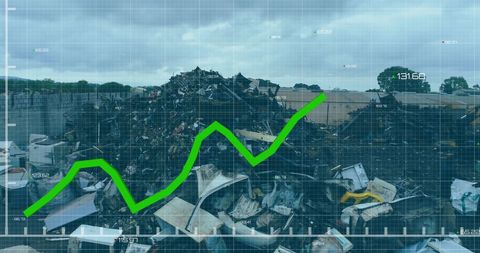
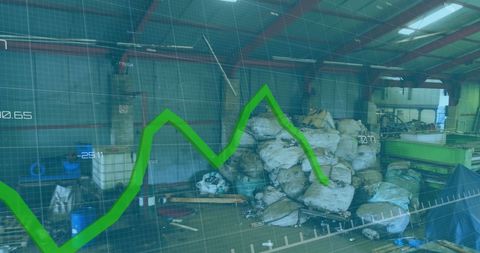
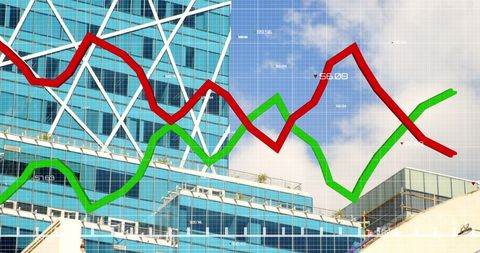
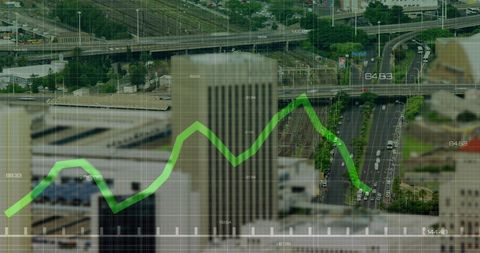
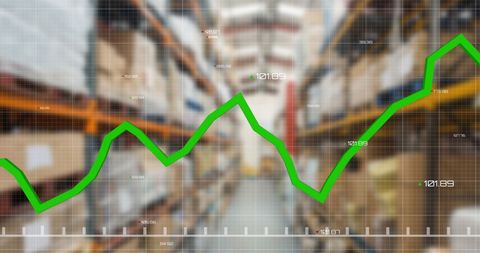
- Data Analysis Overlay on Junkyard Recycling Scene
Data Analysis Overlay on Junkyard Recycling Scene Image
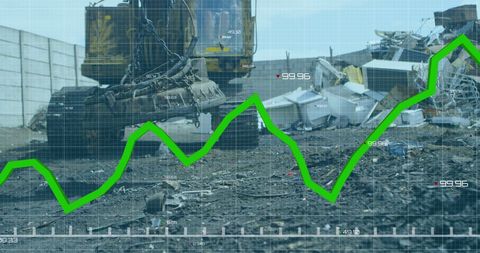
Visual represents data analysis in recycling industry. Ideal for illustrating recycled material value trends, environmental analyses, business analytics, or sustainability initiatives.
Powered by  - Get 15% off with code: PIKWIZARD15


downloads
Tags:
More
Credit Photo
If you would like to credit the Photo, here are some ways you can do so
Text Link
photo Link
<span class="text-link">
<span>
<a target="_blank" href=https://pikwizard.com/photo/data-analysis-overlay-on-junkyard-recycling-scene/35e84ddceec8cab3a6dfbf89ff2e4fea/>PikWizard</a>
</span>
</span>
<span class="image-link">
<span
style="margin: 0 0 20px 0; display: inline-block; vertical-align: middle; width: 100%;"
>
<a
target="_blank"
href="https://pikwizard.com/photo/data-analysis-overlay-on-junkyard-recycling-scene/35e84ddceec8cab3a6dfbf89ff2e4fea/"
style="text-decoration: none; font-size: 10px; margin: 0;"
>
<img src="https://pikwizard.com/pw/medium/35e84ddceec8cab3a6dfbf89ff2e4fea.jpg" style="margin: 0; width: 100%;" alt="" />
<p style="font-size: 12px; margin: 0;">PikWizard</p>
</a>
</span>
</span>
Free (free of charge)
Free for personal and commercial use.
Author: Authentic Images
Similar Free Stock Images

Premium

Premium


Premium

Premium


Premium
Premium


Premium

Premium


Premium


Premium


Premium

Premium

Premium


Premium


Premium

Premium


Premium


Premium


Premium


Premium

Premium


Premium


Premium

Premium

Premium

Explore More Free Stock Images