
- Home >
- Stock Photos >
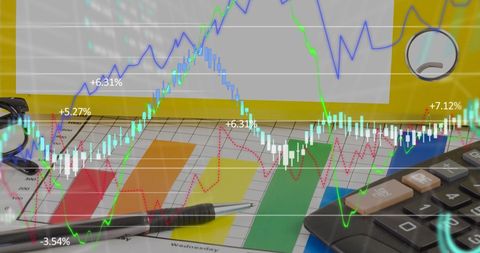
- Data Analysis Visualization with Pen and Graph Overlay
Data Analysis Visualization with Pen and Graph Overlay Image

Person writing on notepad while statistical line graph overlays image, symbolizing integration of technology in analyzing business data. Useful for projects on data visualization, tech-driven business analysis, and finance industry insights.
Powered by 


downloads
Tags:
More
Credit Photo
If you would like to credit the Photo, here are some ways you can do so
Text Link
photo Link
<span class="text-link">
<span>
<a target="_blank" href=https://pikwizard.com/photo/data-analysis-visualization-with-pen-and-graph-overlay/ff52e1d8a5e145113a6f37386dae3eae/>PikWizard</a>
</span>
</span>
<span class="image-link">
<span
style="margin: 0 0 20px 0; display: inline-block; vertical-align: middle; width: 100%;"
>
<a
target="_blank"
href="https://pikwizard.com/photo/data-analysis-visualization-with-pen-and-graph-overlay/ff52e1d8a5e145113a6f37386dae3eae/"
style="text-decoration: none; font-size: 10px; margin: 0;"
>
<img src="https://pikwizard.com/pw/medium/ff52e1d8a5e145113a6f37386dae3eae.jpg" style="margin: 0; width: 100%;" alt="" />
<p style="font-size: 12px; margin: 0;">PikWizard</p>
</a>
</span>
</span>
Free (free of charge)
Free for personal and commercial use.
Author: Authentic Images
Similar Free Stock Images

Premium


Premium

Premium


Premium


Premium

Premium


Premium


Premium


Premium


Premium


Premium


Premium


Premium


Premium


Premium


Premium


Premium


Premium


Premium

Premium


Premium


Premium


Premium


Premium


Premium

Explore More Free Stock Images