
- Home >
- Stock Photos >
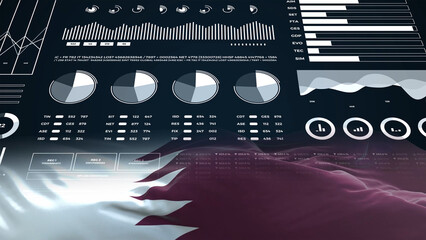
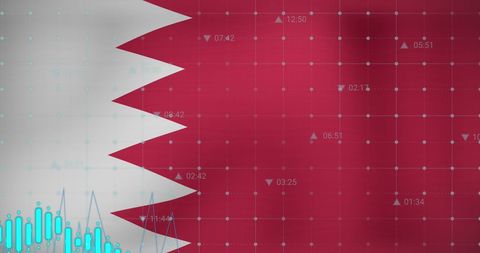
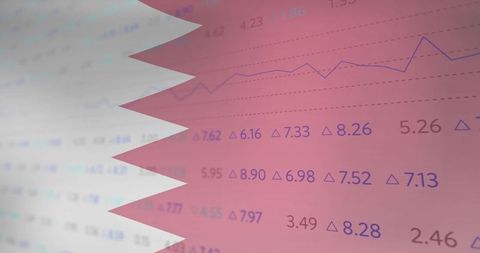
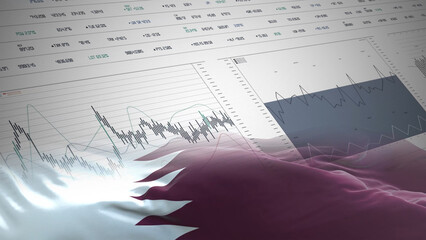
- Data Analysis Visualization with Qatar Flag Background
Data Analysis Visualization with Qatar Flag Background Image

Digital concepts dominate over a Qatar flag, showcasing data analytics and information technology. Graph trends align over rows of binary numbers, symbolizing coding and digital transformation. Ideal use in presentations, educational material, or content related to market analysis or technological advancement in Qatar.
Powered by 


downloads
Tags:
More
Credit Photo
If you would like to credit the Photo, here are some ways you can do so
Text Link
photo Link
<span class="text-link">
<span>
<a target="_blank" href=https://pikwizard.com/photo/data-analysis-visualization-with-qatar-flag-background/508d57493347717adf01d97ca866bed0/>PikWizard</a>
</span>
</span>
<span class="image-link">
<span
style="margin: 0 0 20px 0; display: inline-block; vertical-align: middle; width: 100%;"
>
<a
target="_blank"
href="https://pikwizard.com/photo/data-analysis-visualization-with-qatar-flag-background/508d57493347717adf01d97ca866bed0/"
style="text-decoration: none; font-size: 10px; margin: 0;"
>
<img src="https://pikwizard.com/pw/medium/508d57493347717adf01d97ca866bed0.jpg" style="margin: 0; width: 100%;" alt="" />
<p style="font-size: 12px; margin: 0;">PikWizard</p>
</a>
</span>
</span>
Free (free of charge)
Free for personal and commercial use.
Author: Authentic Images
Similar Free Stock Images

Premium
Premium

Premium


Premium


Premium


Premium


Premium


Premium


Premium


Premium


Premium


Premium

Premium


Premium


Premium


Premium


Premium


Premium


Premium


Premium


Premium


Premium


Premium


Premium


Premium


Explore More Free Stock Images