- Home >
- Stock Photos >
- Data Analysis with 3D Charts and Graphs
Data Analysis with 3D Charts and Graphs Image

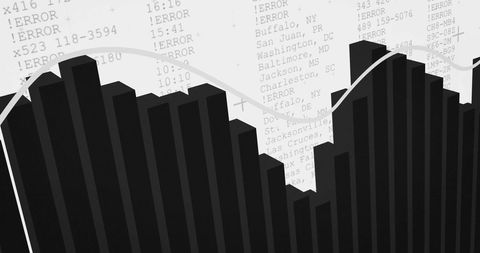
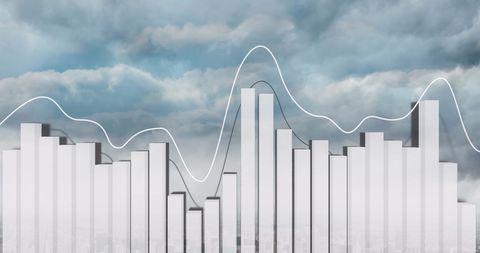
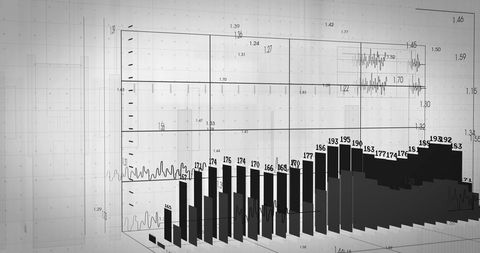
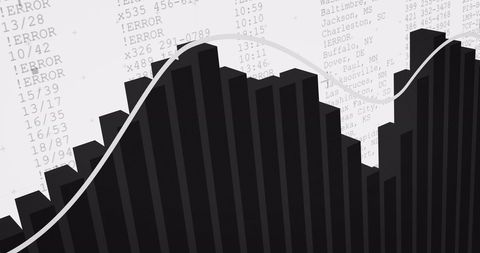
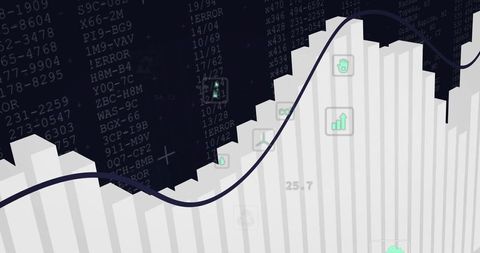
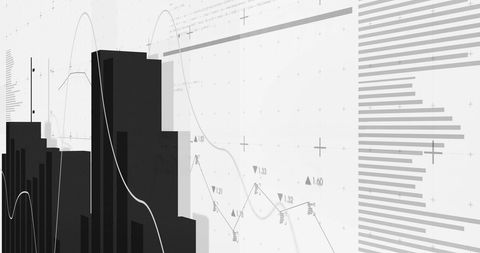
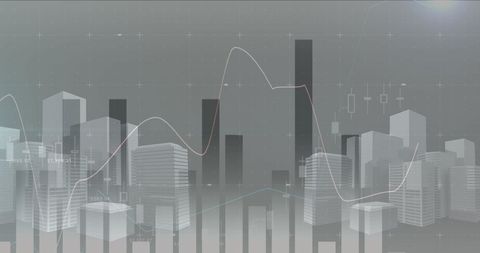
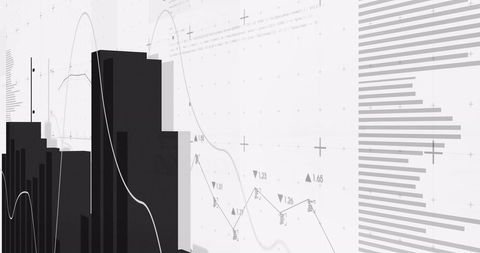
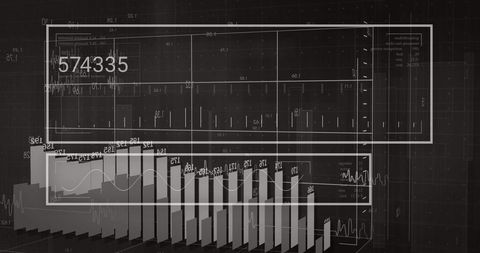
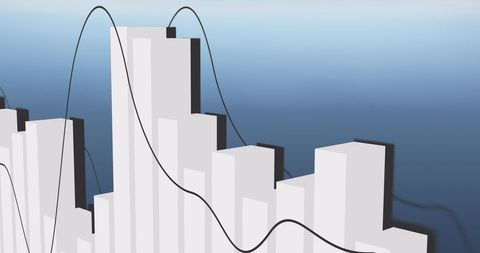
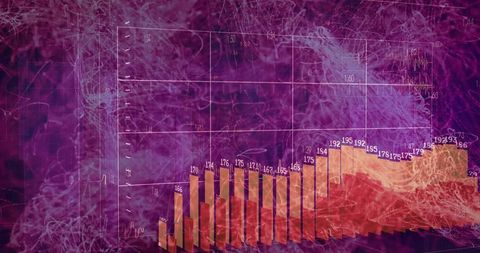
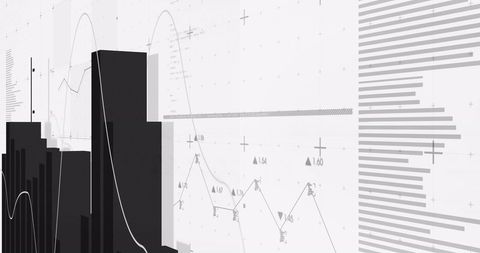
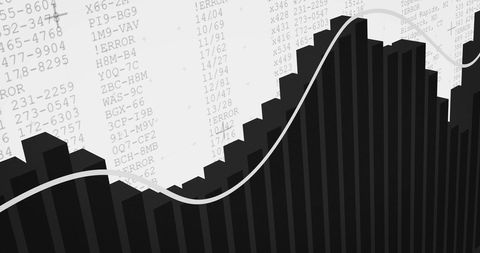
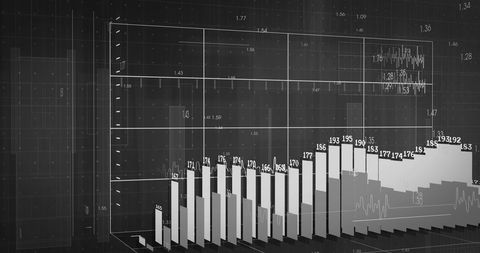
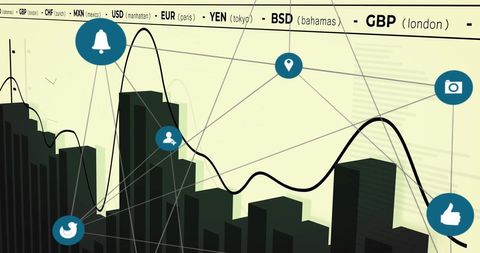
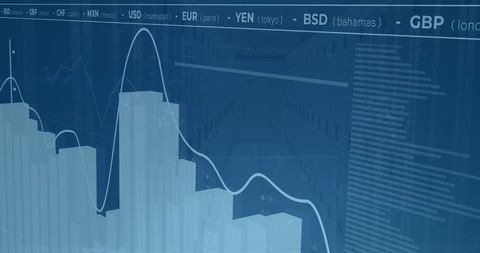
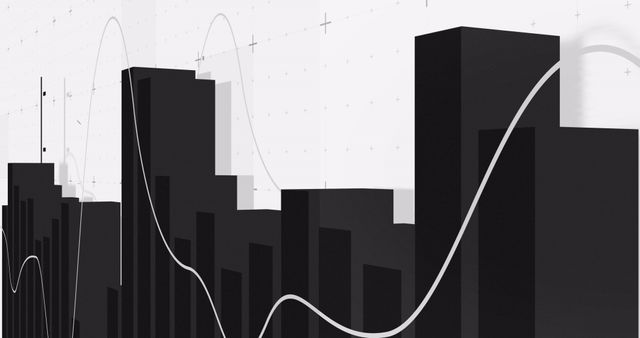
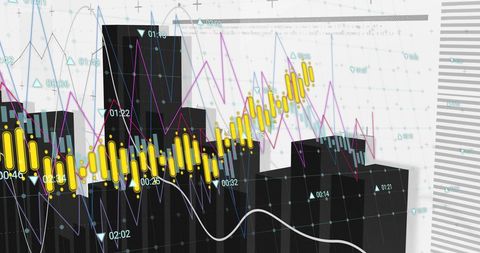
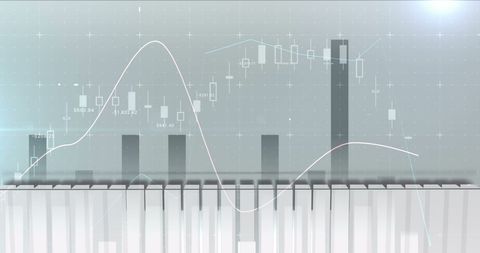
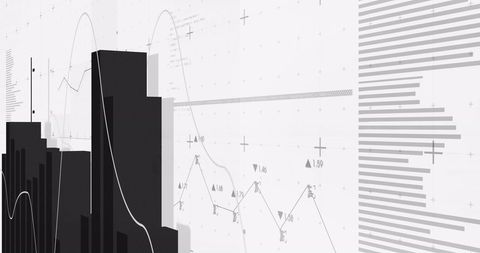
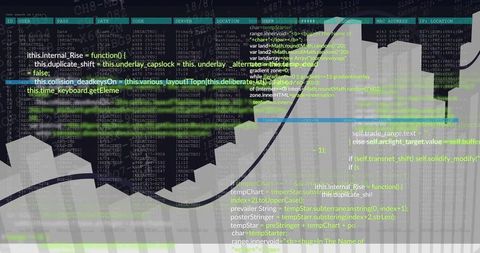
Black bars represent statistical data amidst fluctuating line graphs, reflecting concepts of economic growth, business analytics, and data visualization. Use for illustrating financial reports, statistics presentations, and technological innovations in algorithms showcasing data interconnectivity.

downloads
Tags:
More
Credit Photo
If you would like to credit the Photo, here are some ways you can do so
Text Link
photo Link
<span class="text-link">
<span>
<a target="_blank" href=https://pikwizard.com/photo/data-analysis-with-3d-charts-and-graphs/145d0d0c14c704678d1f9e95229c1a4a/>PikWizard</a>
</span>
</span>
<span class="image-link">
<span
style="margin: 0 0 20px 0; display: inline-block; vertical-align: middle; width: 100%;"
>
<a
target="_blank"
href="https://pikwizard.com/photo/data-analysis-with-3d-charts-and-graphs/145d0d0c14c704678d1f9e95229c1a4a/"
style="text-decoration: none; font-size: 10px; margin: 0;"
>
<img src="https://pikwizard.com/pw/medium/145d0d0c14c704678d1f9e95229c1a4a.jpg" style="margin: 0; width: 100%;" alt="" />
<p style="font-size: 12px; margin: 0;">PikWizard</p>
</a>
</span>
</span>
Free (free of charge)
Free for personal and commercial use.
Author: Creative Art