- Home >
- Stock Photos >
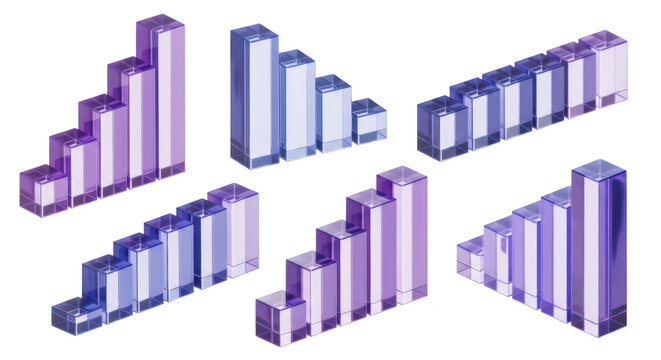
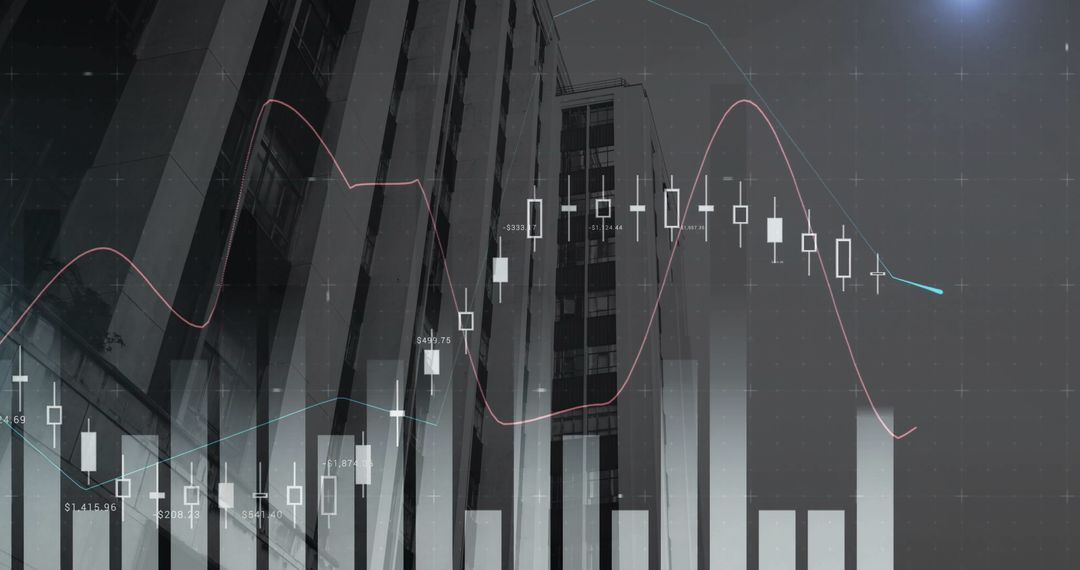
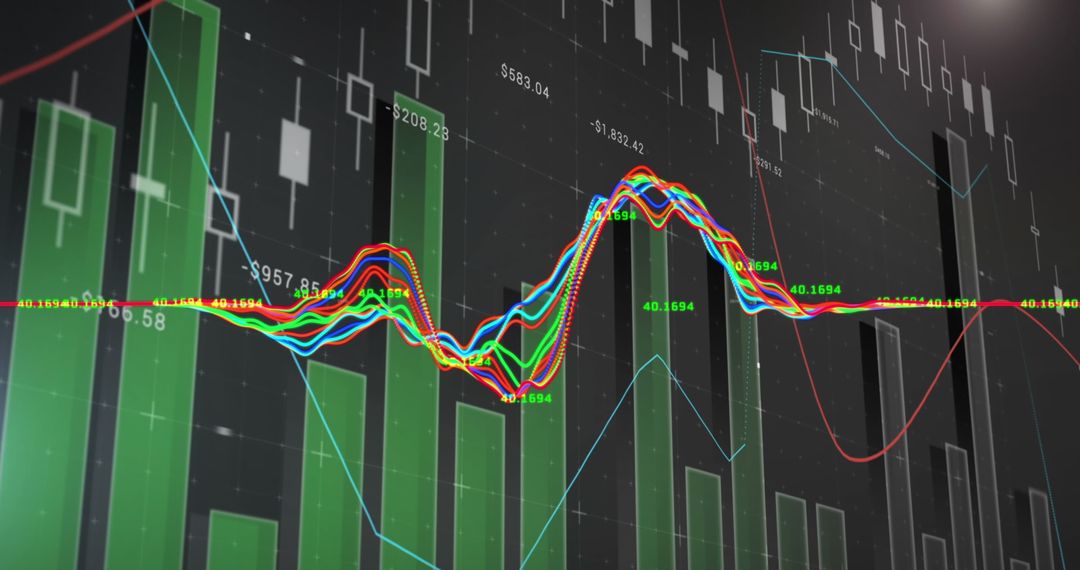
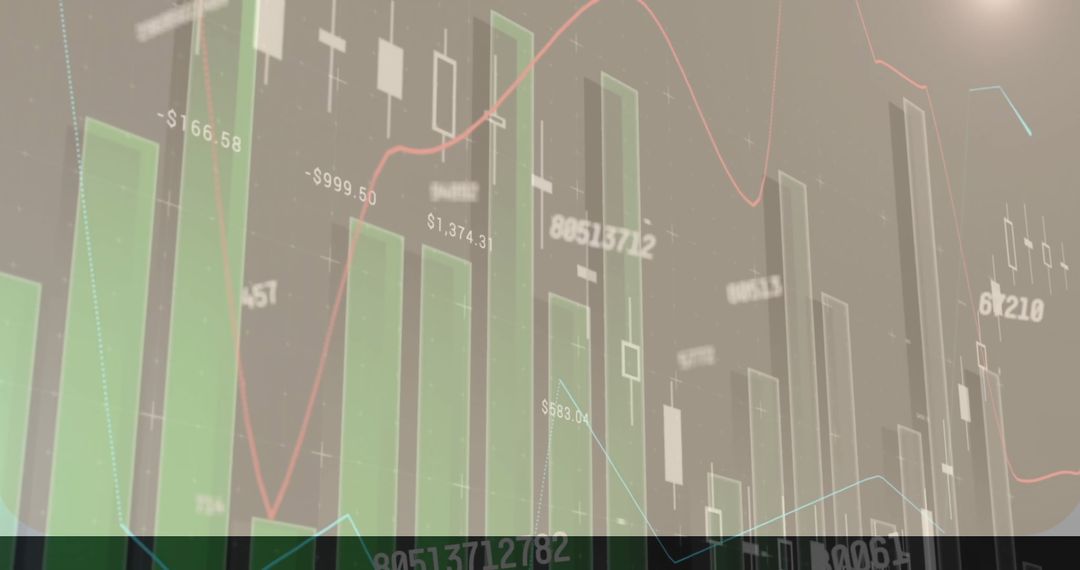
- Data Analysis with 3D Financial Charts on Digital Interface
Data Analysis with 3D Financial Charts on Digital Interface Image

Visual representation of complex financial data with futuristic 3D charts and graphs overlaying a digital interface backdrop. Ideal for use in presentations related to global finance, technological advancements in economic data reporting, business analytics, or stock market analysis materials.
Powered by 


2
downloads
downloads
Tags:
More
Credit Photo
If you would like to credit the Photo, here are some ways you can do so
Text Link
photo Link
<span class="text-link">
<span>
<a target="_blank" href=https://pikwizard.com/photo/data-analysis-with-3d-financial-charts-on-digital-interface/73ad7f1a0aa3c82b3788f2616d8b743a/>PikWizard</a>
</span>
</span>
<span class="image-link">
<span
style="margin: 0 0 20px 0; display: inline-block; vertical-align: middle; width: 100%;"
>
<a
target="_blank"
href="https://pikwizard.com/photo/data-analysis-with-3d-financial-charts-on-digital-interface/73ad7f1a0aa3c82b3788f2616d8b743a/"
style="text-decoration: none; font-size: 10px; margin: 0;"
>
<img src="https://pikwizard.com/pw/medium/73ad7f1a0aa3c82b3788f2616d8b743a.jpg" style="margin: 0; width: 100%;" alt="" />
<p style="font-size: 12px; margin: 0;">PikWizard</p>
</a>
</span>
</span>
Free (free of charge)
Free for personal and commercial use.
Author: People Creations
Similar Free Stock Images

Premium


Premium


Premium


Premium


Premium


Premium


Premium


Premium


Premium


Premium


Premium


Premium


Premium


Premium


Premium


Premium


Premium


Premium


Premium


Premium


Premium


Premium


Premium


Premium