- Home >
- Stock Photos >
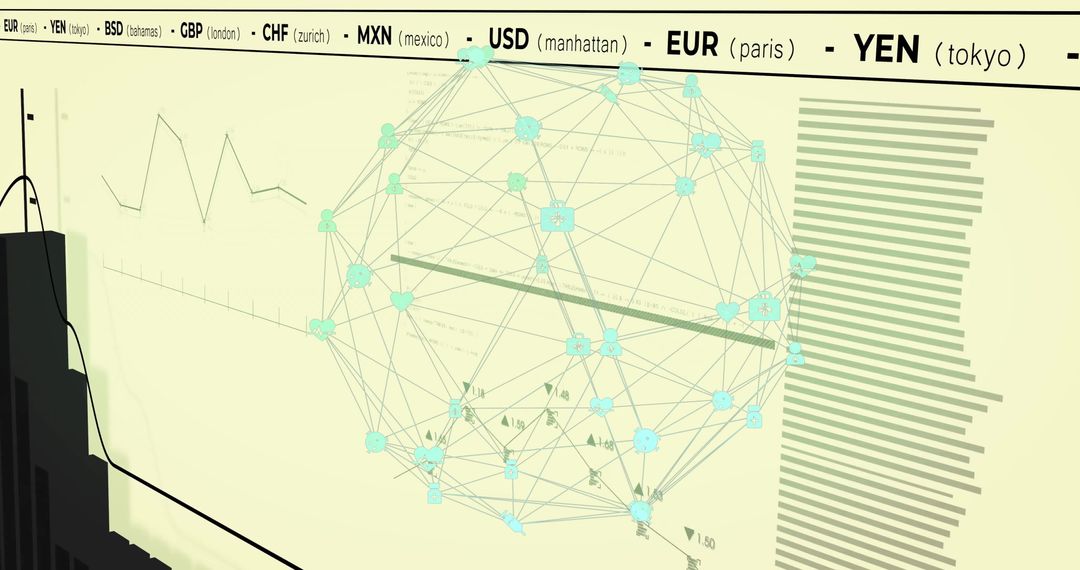
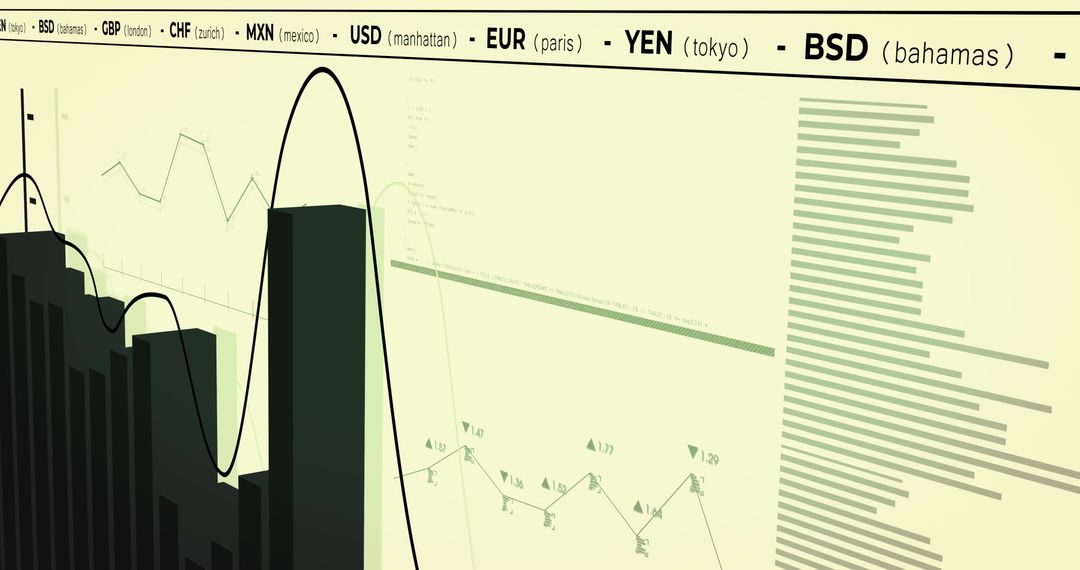
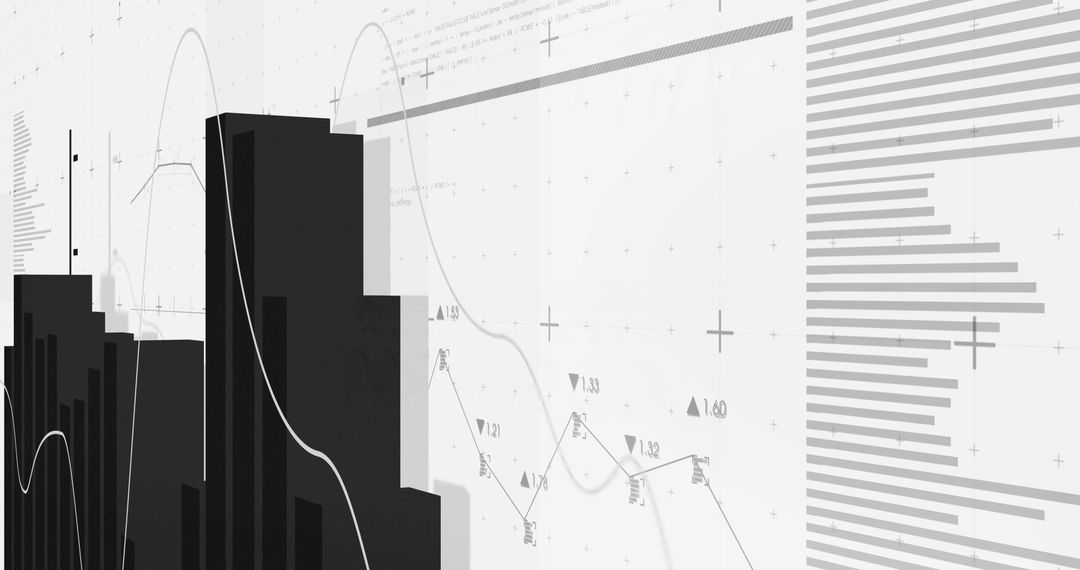
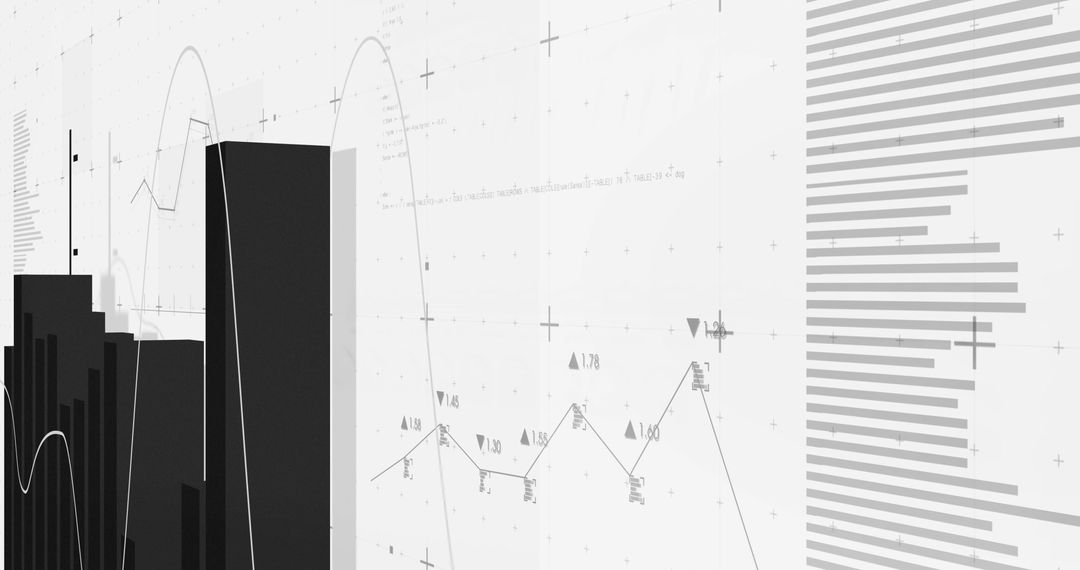
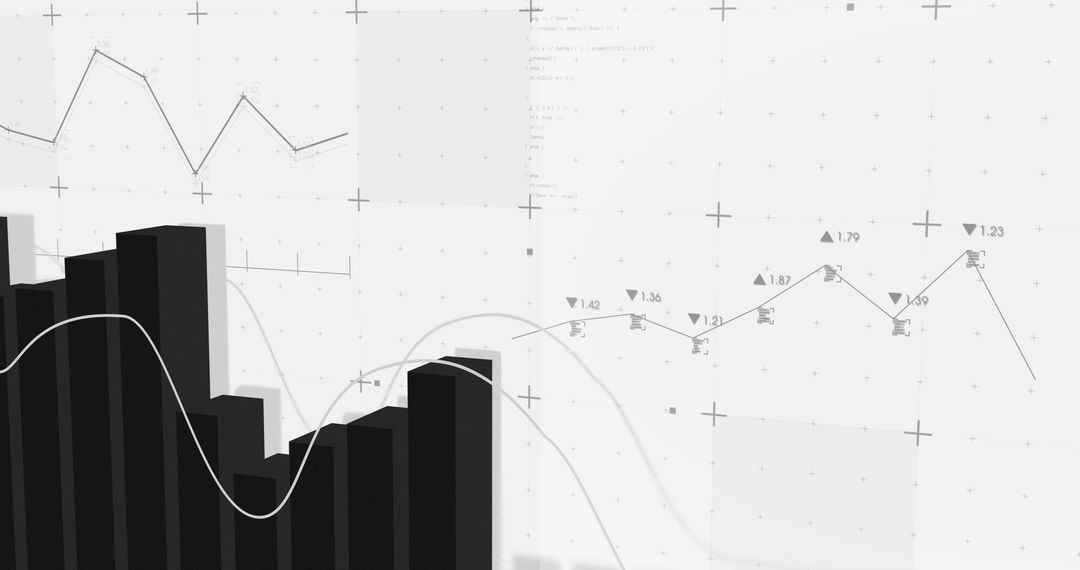
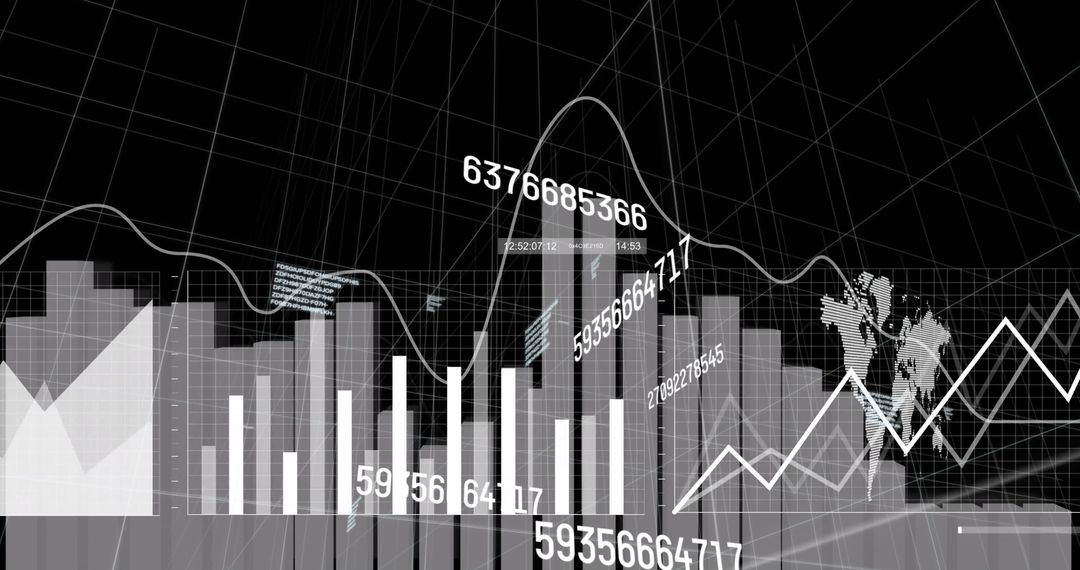
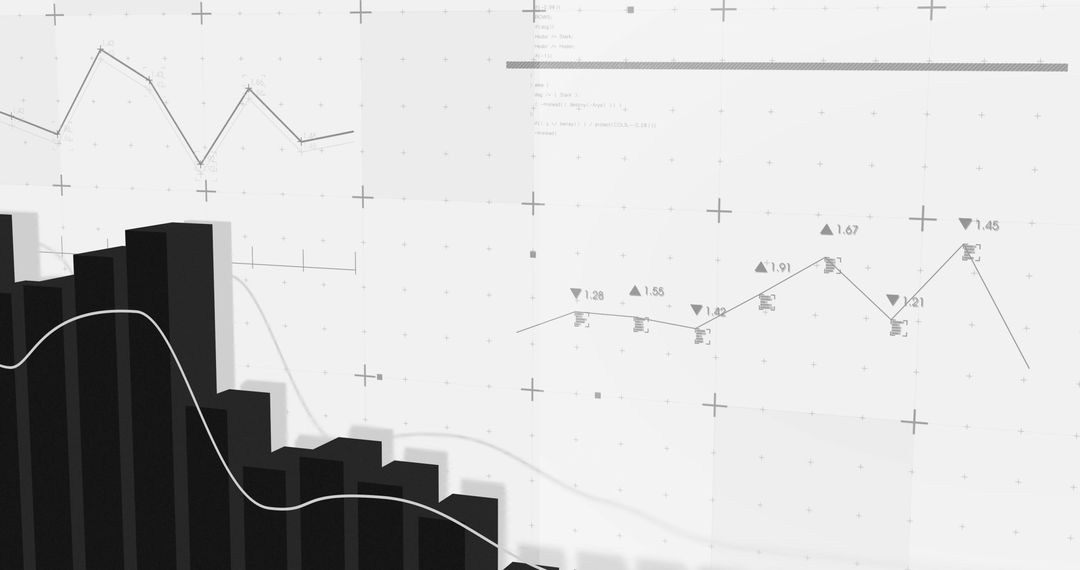
- Data Analysis with Abstract Financial Graphics Design
Data Analysis with Abstract Financial Graphics Design Image
Mathematical charts and graphical elements represent analytical data processes. Especially useful for business analytics animations and presentations, demonstrating modern financial computations. Useful for illustrating stock market reviews, economic reports, educational visual material on finance, conveying complexity and depth in data understanding.
Powered by  - Get 15% off with code: PIKWIZARD15


2
downloads
downloads
Tags:
More
Credit Photo
If you would like to credit the Photo, here are some ways you can do so
Text Link
photo Link
<span class="text-link">
<span>
<a target="_blank" href=https://pikwizard.com/photo/data-analysis-with-abstract-financial-graphics-design/8a9947b94ae34d3951b4751739d11759/>PikWizard</a>
</span>
</span>
<span class="image-link">
<span
style="margin: 0 0 20px 0; display: inline-block; vertical-align: middle; width: 100%;"
>
<a
target="_blank"
href="https://pikwizard.com/photo/data-analysis-with-abstract-financial-graphics-design/8a9947b94ae34d3951b4751739d11759/"
style="text-decoration: none; font-size: 10px; margin: 0;"
>
<img src="https://pikwizard.com/pw/medium/8a9947b94ae34d3951b4751739d11759.jpg" style="margin: 0; width: 100%;" alt="" />
<p style="font-size: 12px; margin: 0;">PikWizard</p>
</a>
</span>
</span>
Free (free of charge)
Free for personal and commercial use.
Author: Authentic Images
Similar Free Stock Images

Premium


Premium


Premium


Premium


Premium


Premium


Premium


Premium


Premium


Premium


Premium


Premium


Premium

Premium


Premium


Premium


Premium


Premium


Premium


Premium


Premium


Premium


Premium


Premium