
- Home >
- Stock Photos >
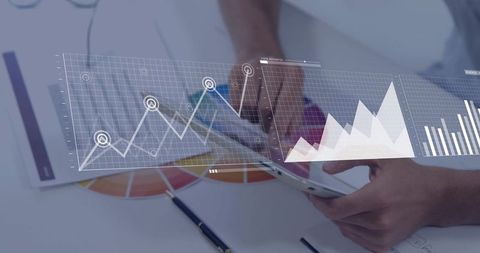
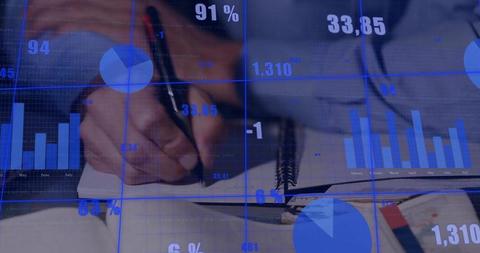
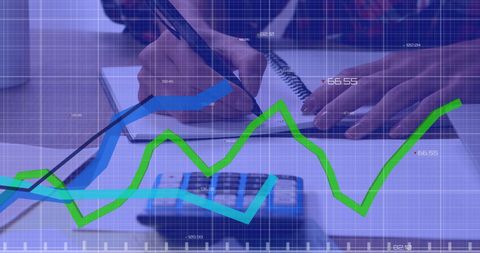
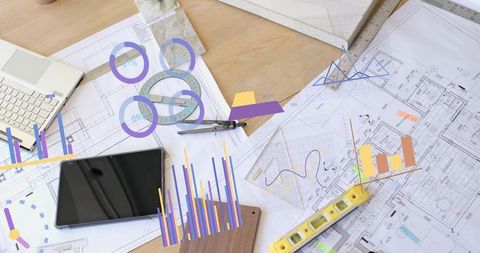
- Data Analysis with Financial Chart on Digital Tablet Display
Data Analysis with Financial Chart on Digital Tablet Display Image

Illustrates a business environment with digital interface focused on financial data processing. Ideal for content related to finance, business analysis, technology integration in economics, and statistical tools. Can be used in blogs, presentations, or advertisements targeting professionals in finance or business sectors.
Powered by 


downloads
Tags:
More
Credit Photo
If you would like to credit the Photo, here are some ways you can do so
Text Link
photo Link
<span class="text-link">
<span>
<a target="_blank" href=https://pikwizard.com/photo/data-analysis-with-financial-chart-on-digital-tablet-display/13f808ebec7914f1d0125fbe933c9450/>PikWizard</a>
</span>
</span>
<span class="image-link">
<span
style="margin: 0 0 20px 0; display: inline-block; vertical-align: middle; width: 100%;"
>
<a
target="_blank"
href="https://pikwizard.com/photo/data-analysis-with-financial-chart-on-digital-tablet-display/13f808ebec7914f1d0125fbe933c9450/"
style="text-decoration: none; font-size: 10px; margin: 0;"
>
<img src="https://pikwizard.com/pw/medium/13f808ebec7914f1d0125fbe933c9450.jpg" style="margin: 0; width: 100%;" alt="" />
<p style="font-size: 12px; margin: 0;">PikWizard</p>
</a>
</span>
</span>
Free (free of charge)
Free for personal and commercial use.
Author: Awesome Content
Similar Free Stock Images

Premium


Premium

Premium


Premium


Premium


Premium


Premium


Premium

Premium


Premium


Premium

Premium


Premium


Premium


Premium


Premium


Premium


Premium


Premium


Premium


Premium


Premium


Premium


Premium

Premium


Explore More Free Stock Images