
- Home >
- Stock Photos >
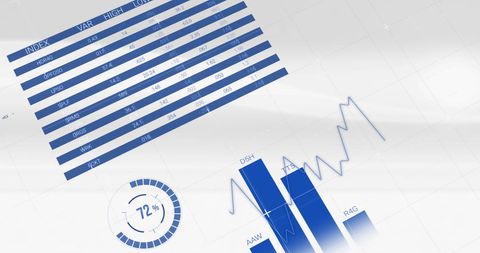
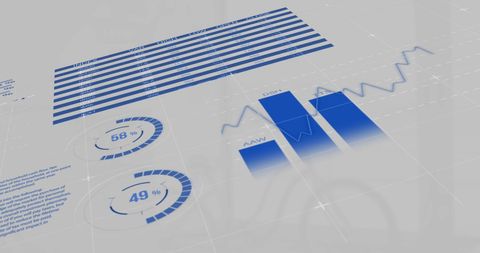
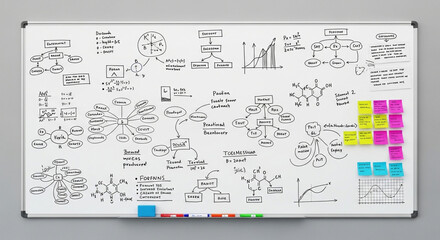
- Data Analysis with Graphs and Equations
Data Analysis with Graphs and Equations Image

Depicting data populated with graphs and equations, perfect for conveying concepts in data science and analytics. Useful for articles discussing business statistics, data analysis tools, or illustrating digital technological advancements.
Powered by 


downloads
Tags:
More
Credit Photo
If you would like to credit the Photo, here are some ways you can do so
Text Link
photo Link
<span class="text-link">
<span>
<a target="_blank" href=https://pikwizard.com/photo/data-analysis-with-graphs-and-equations/52877dd742698c53ba9ba958e621ab34/>PikWizard</a>
</span>
</span>
<span class="image-link">
<span
style="margin: 0 0 20px 0; display: inline-block; vertical-align: middle; width: 100%;"
>
<a
target="_blank"
href="https://pikwizard.com/photo/data-analysis-with-graphs-and-equations/52877dd742698c53ba9ba958e621ab34/"
style="text-decoration: none; font-size: 10px; margin: 0;"
>
<img src="https://pikwizard.com/pw/medium/52877dd742698c53ba9ba958e621ab34.jpg" style="margin: 0; width: 100%;" alt="" />
<p style="font-size: 12px; margin: 0;">PikWizard</p>
</a>
</span>
</span>
Free (free of charge)
Free for personal and commercial use.
Author: Authentic Images
Similar Free Stock Images

Premium


Premium

Premium


Premium


Premium


Premium


Premium


Premium


Premium


Premium


Premium


Premium


Premium


Premium


Premium


Premium


Premium

Premium


Premium

Premium

Premium


Premium


Premium


Premium


Premium


Explore More Free Stock Images