
- Home >
- Stock Photos >
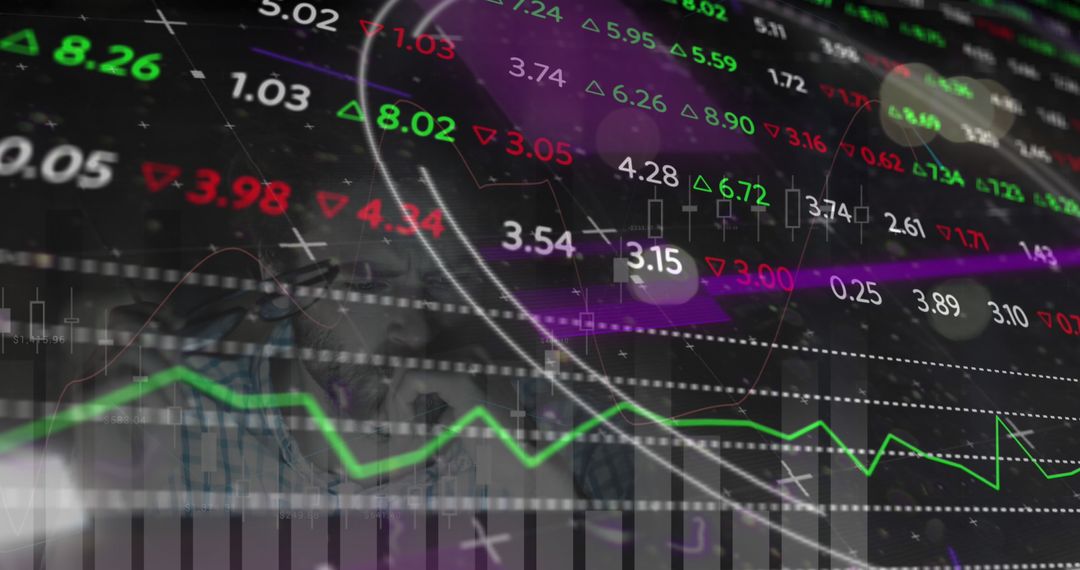
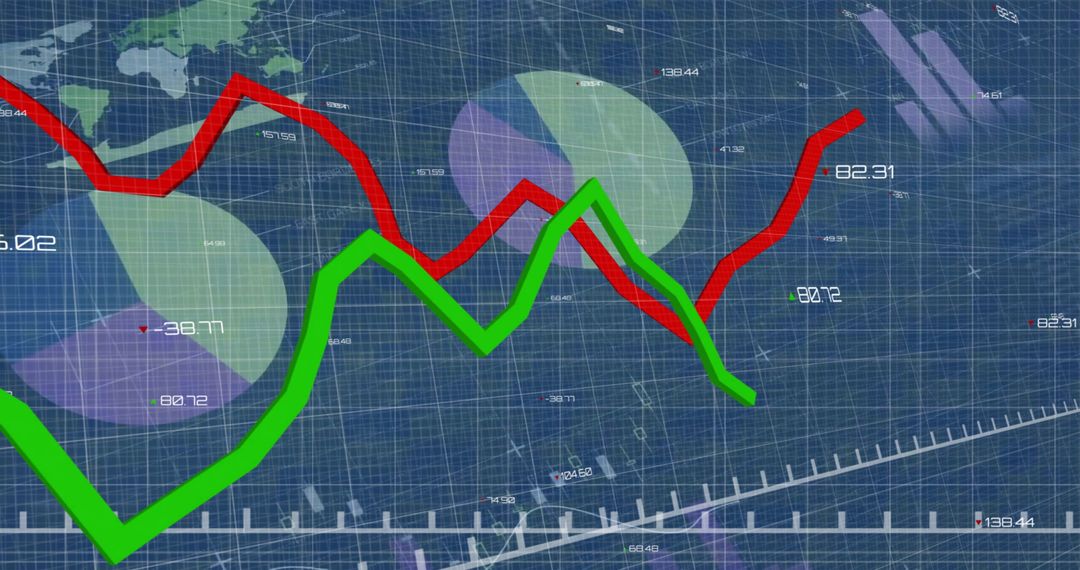
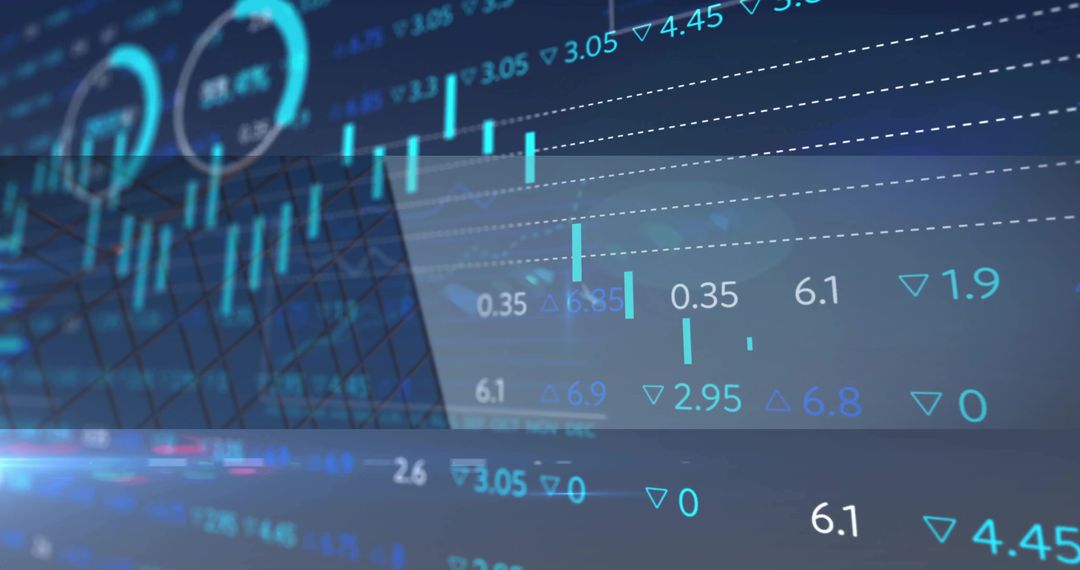
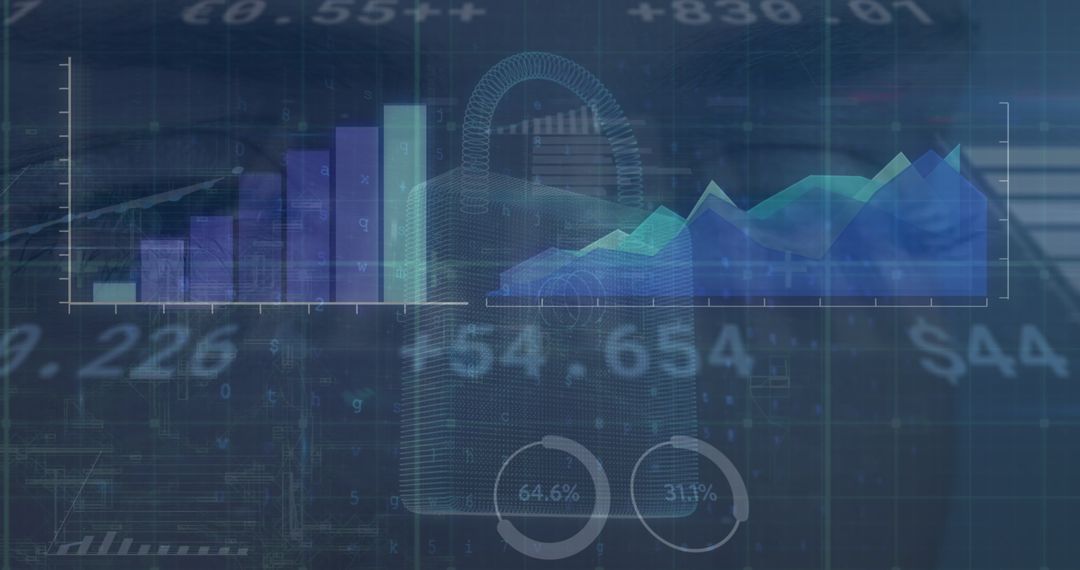
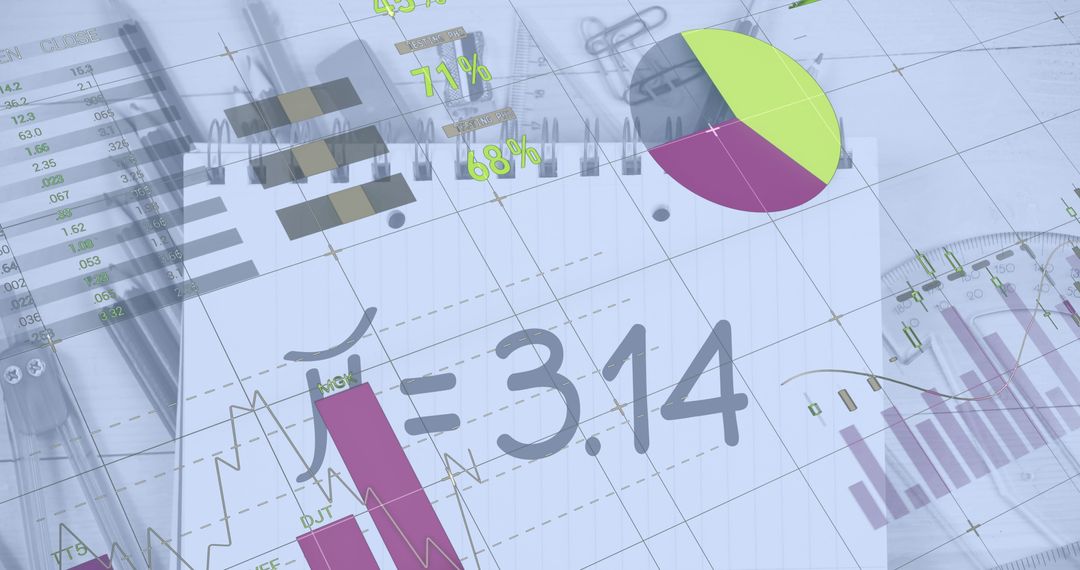
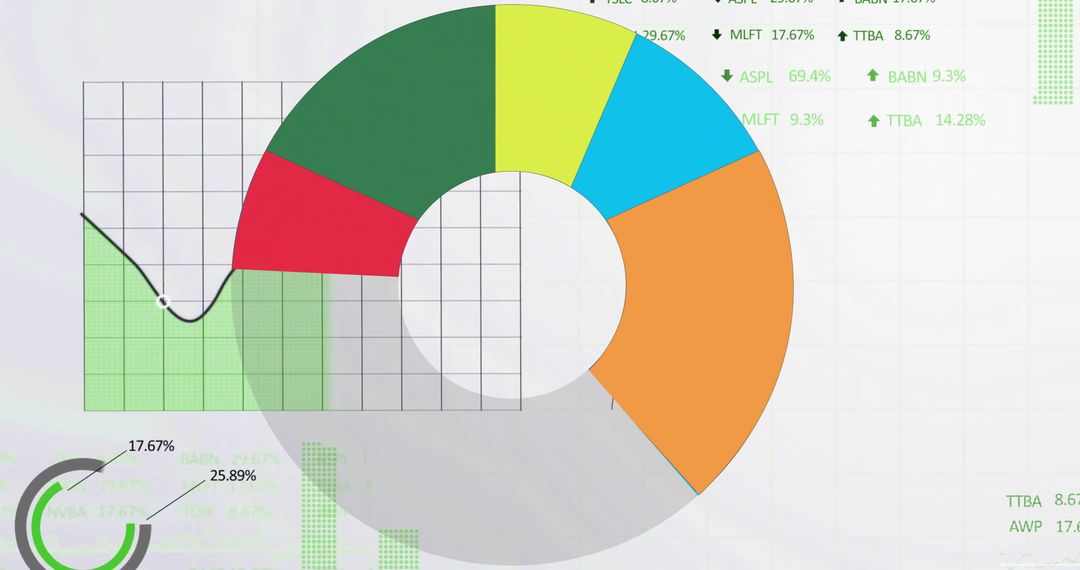
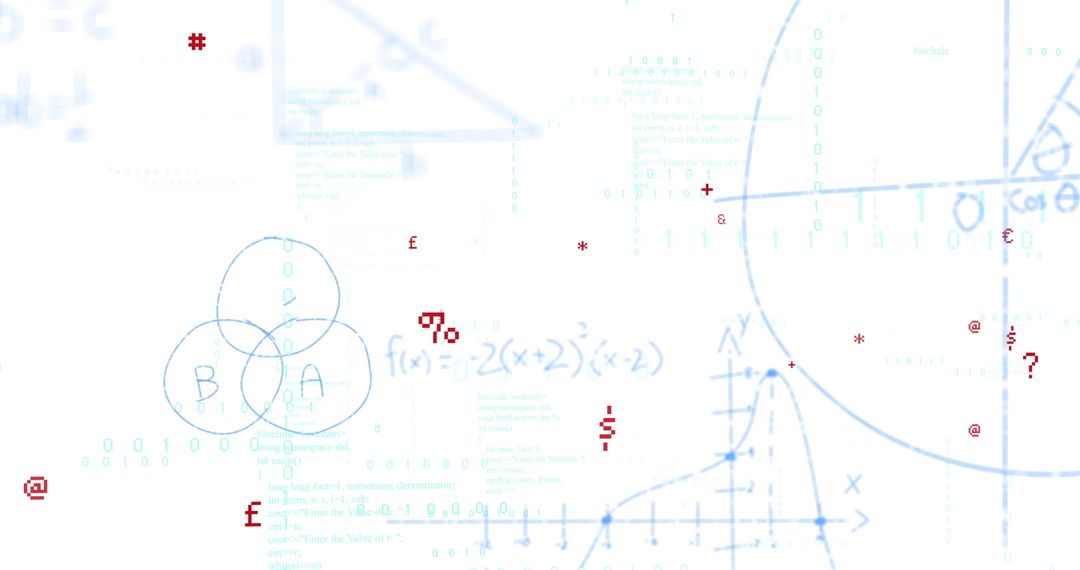
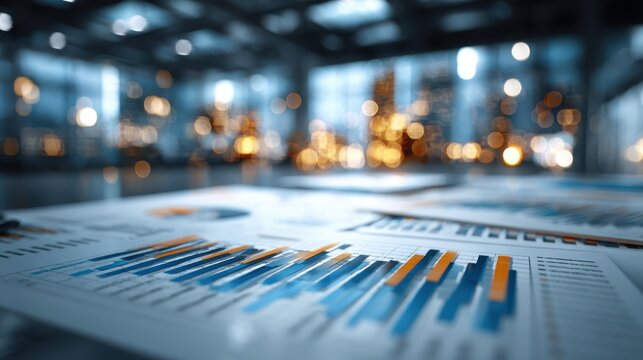
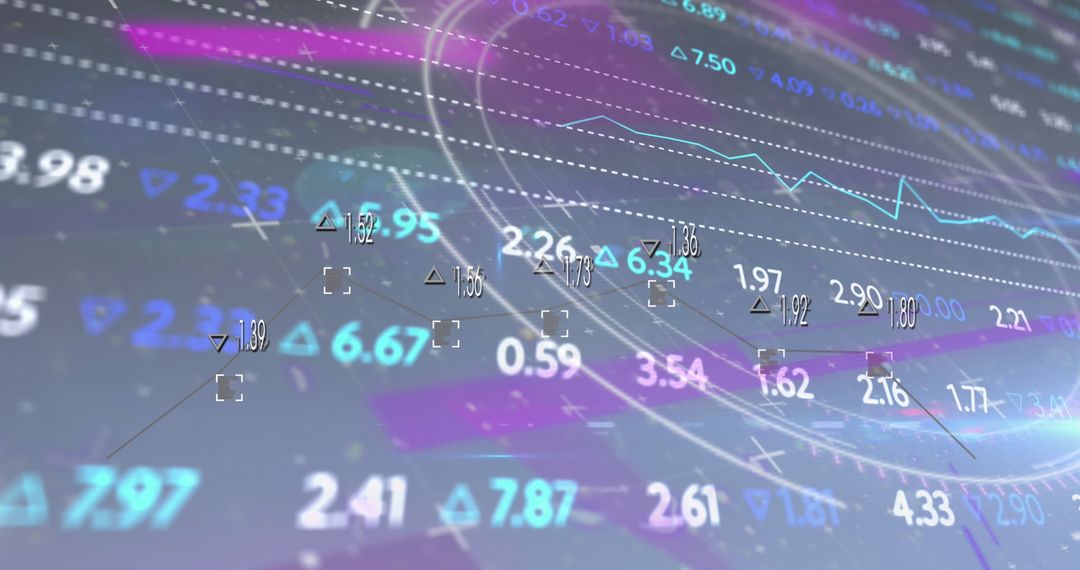
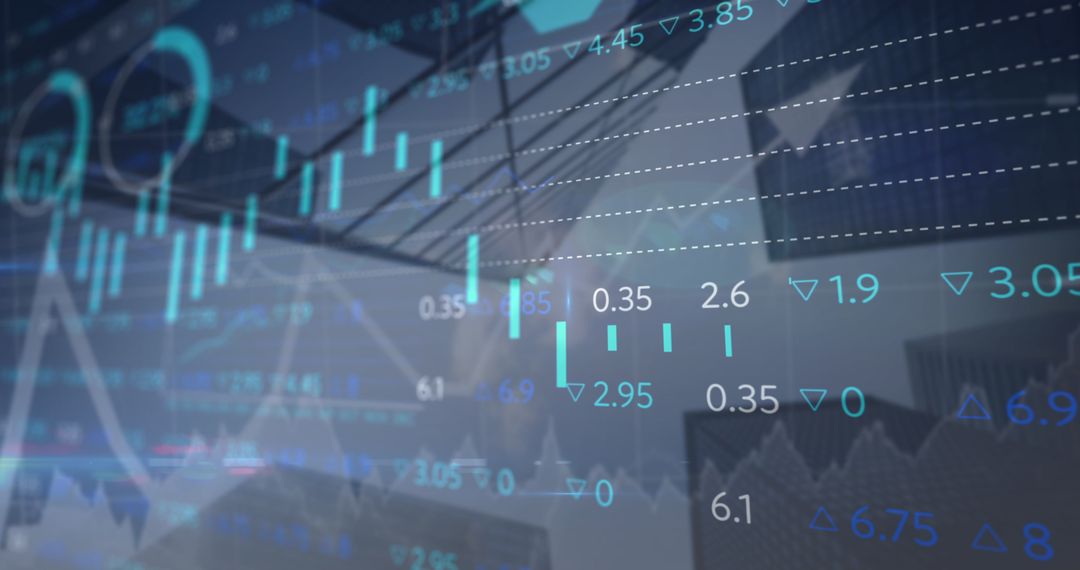
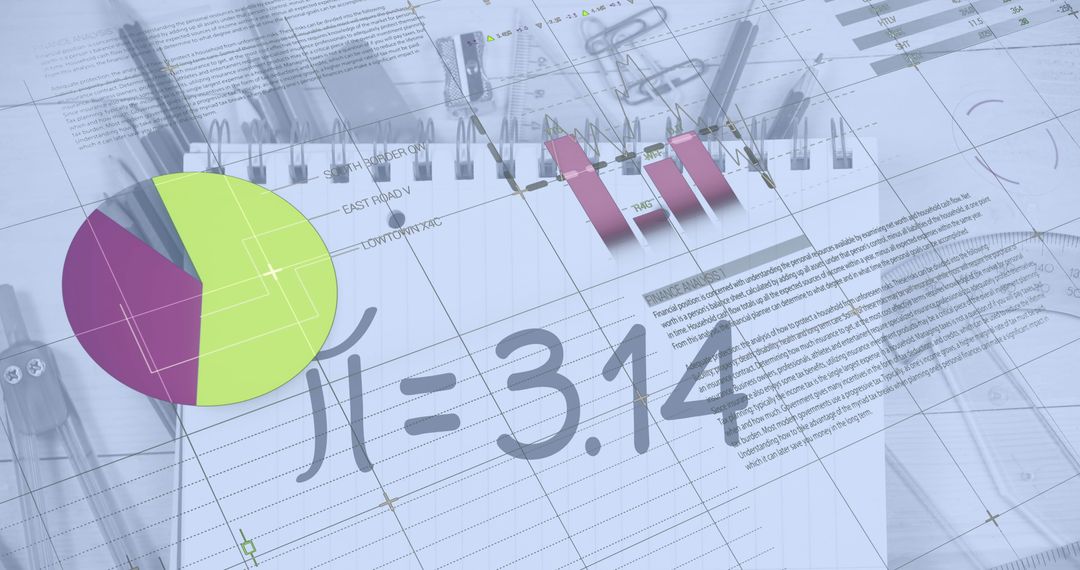
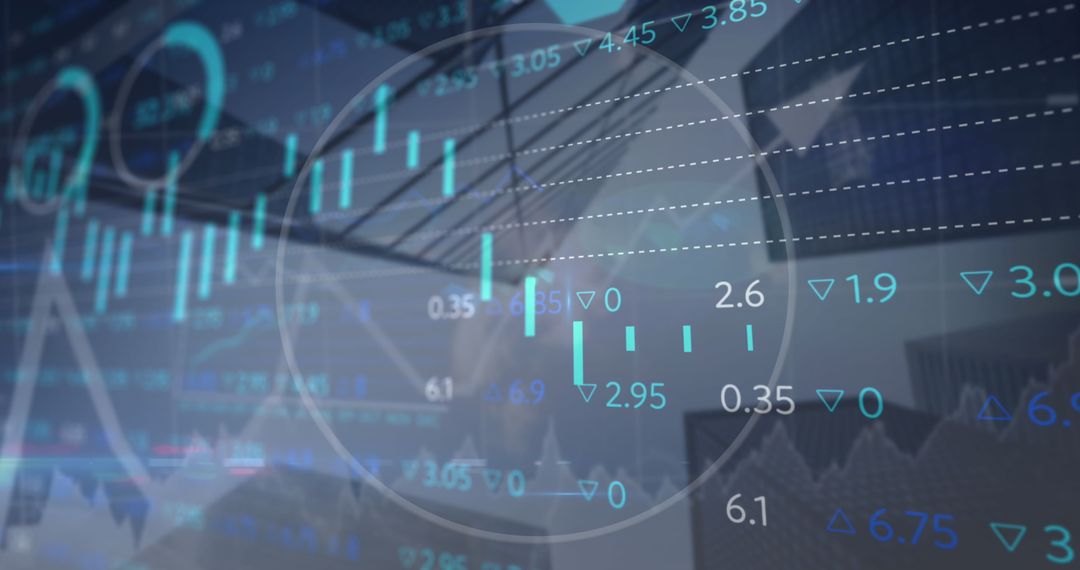
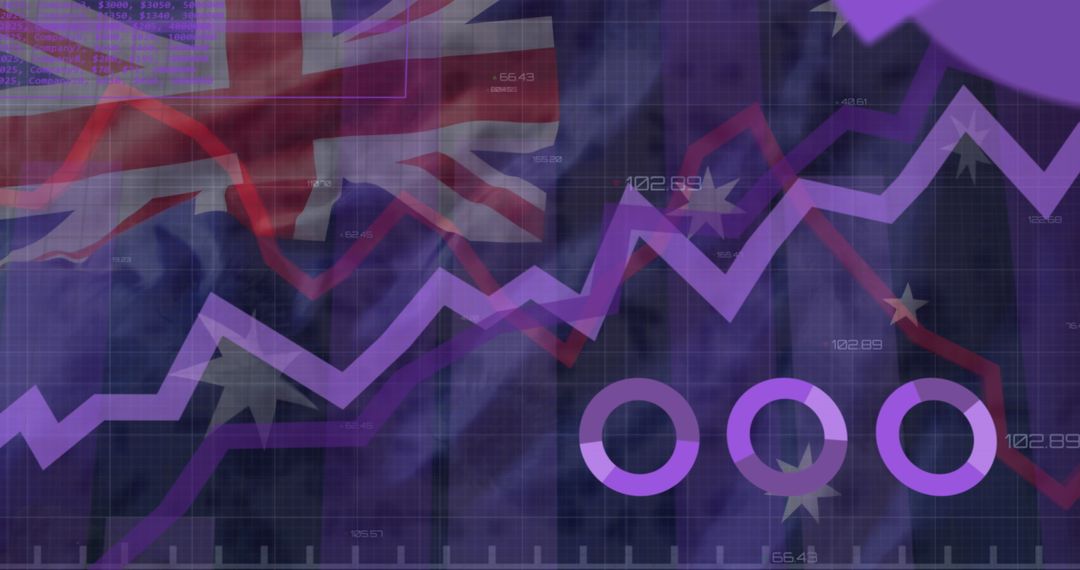
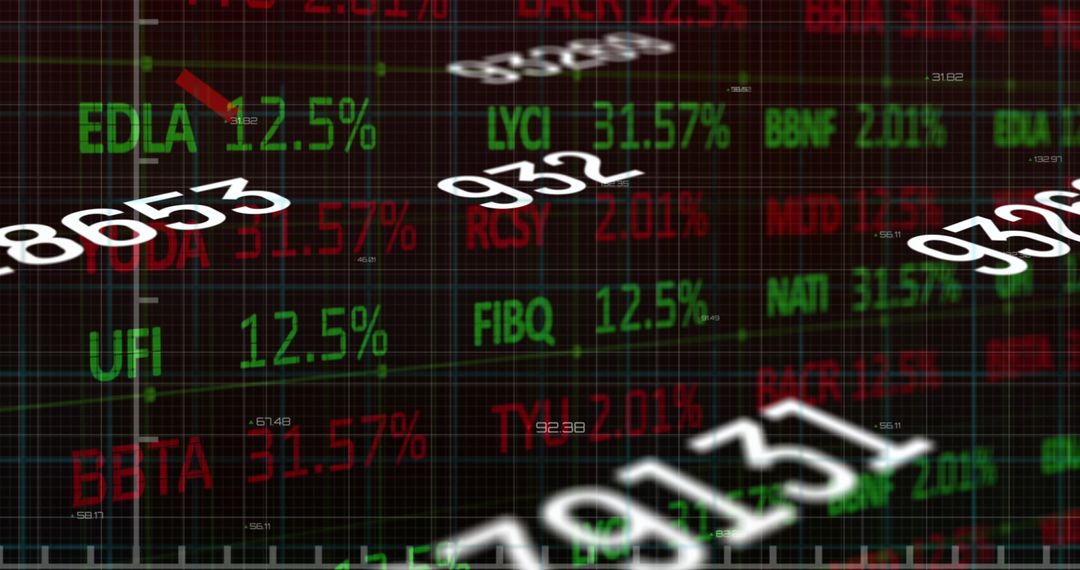
- Data Analysis with Network of Financial Connections and Graphs
Data Analysis with Network of Financial Connections and Graphs Image
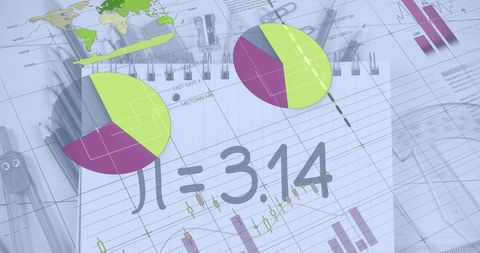
Visually representing financial data through graphs, charts, and global connections, this imagery highlights data analysis and global financial trends. Ideal for illustrating budget strategies, market research, or technological advancements in business publications, presentations, and digital marketing.
Powered by 


2
downloads
downloads
Tags:
More
Credit Photo
If you would like to credit the Photo, here are some ways you can do so
Text Link
photo Link
<span class="text-link">
<span>
<a target="_blank" href=https://pikwizard.com/photo/data-analysis-with-network-of-financial-connections-and-graphs/8e1f9c6a57c2bf7f5ced3035051e1d93/>PikWizard</a>
</span>
</span>
<span class="image-link">
<span
style="margin: 0 0 20px 0; display: inline-block; vertical-align: middle; width: 100%;"
>
<a
target="_blank"
href="https://pikwizard.com/photo/data-analysis-with-network-of-financial-connections-and-graphs/8e1f9c6a57c2bf7f5ced3035051e1d93/"
style="text-decoration: none; font-size: 10px; margin: 0;"
>
<img src="https://pikwizard.com/pw/medium/8e1f9c6a57c2bf7f5ced3035051e1d93.jpg" style="margin: 0; width: 100%;" alt="" />
<p style="font-size: 12px; margin: 0;">PikWizard</p>
</a>
</span>
</span>
Free (free of charge)
Free for personal and commercial use.
Author: Creative Art
Similar Free Stock Images

Premium


Premium


Premium


Premium


Premium


Premium


Premium


Premium


Premium


Premium


Premium


Premium


Premium


Premium


Premium


Premium


Premium


Premium


Premium


Premium


Premium


Premium


Premium


Premium

