
- Home >
- Free Stock Photos & Images >
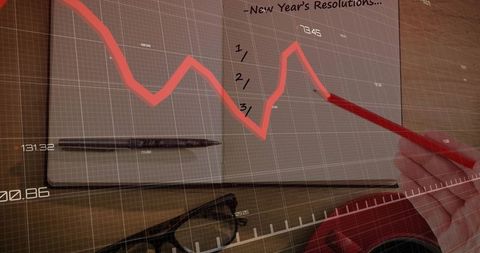
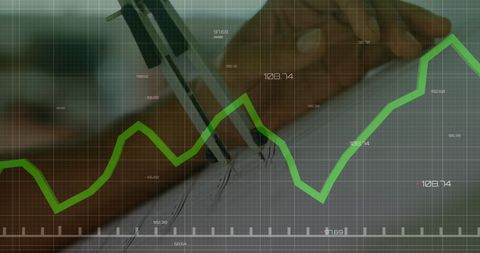
- Data Analyst Charting Decrease in Statistics at Desk
Data Analyst Charting Decrease in Statistics at Desk Free Stock Image

Data analyst actively tracing a declining graph line represented over an open notebook, blending digital interface technology with classical record-keeping. This illustrated scene emphasizes data analysis, productivity in modern work environments, technological innovation through instilled focus on accuracy. Ideal for use in related to business analytics, professional work, insights on financial markets, commerce trends, educational themes in mathematics or statistics.
Powered by  - Get 15% off with code: PIKWIZARD15


downloads
Tags:
More
Credit Photo
If you would like to credit the Photo, here are some ways you can do so
Text Link
photo Link
<span class="text-link">
<span>
<a target="_blank" href=https://pikwizard.com/photo/data-analyst-charting-decrease-in-statistics-at-desk/0b99138bd03c1c5e2558753d661f49d0/>PikWizard</a>
</span>
</span>
<span class="image-link">
<span
style="margin: 0 0 20px 0; display: inline-block; vertical-align: middle; width: 100%;"
>
<a
target="_blank"
href="https://pikwizard.com/photo/data-analyst-charting-decrease-in-statistics-at-desk/0b99138bd03c1c5e2558753d661f49d0/"
style="text-decoration: none; font-size: 10px; margin: 0;"
>
<img src="https://thumbs.wbm.im/pw/medium/0b99138bd03c1c5e2558753d661f49d0.jpg" style="margin: 0; width: 100%;" alt="Data Analyst Charting Decrease in Statistics at Desk" />
<p style="font-size: 12px; margin: 0;">PikWizard</p>
</a>
</span>
</span>
Free (free of charge)
Free for personal and commercial use.
Author: Authentic Images
Similar Free Stock Images


Premium


Premium


Premium


Premium


Premium


Premium


Premium


Premium


Premium


Premium


Premium


Premium


Premium


Premium


Premium


Premium


Premium


Premium


Premium


Premium


Premium


Premium


Premium


Premium


Premium
Explore More Free Stock Images