
- Home >
- Stock Photos >
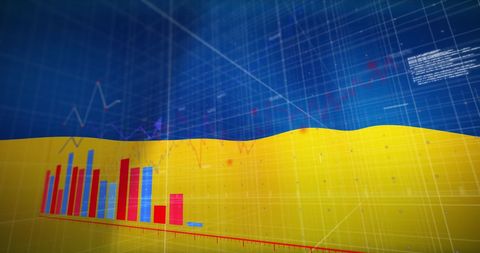
- Data Analyst Examining Digital Bar Chart with 3D Elements
Data Analyst Examining Digital Bar Chart with 3D Elements Image

Image depicts data analyst leaning forward and interacting with a futuristic digital bar chart on a colorful grid background. It highlights financial analytics and professional insights in a 3D visual style, emphasizing innovation. Ideal for use in presentations, blogs, or articles related to data visualization, financial analysis, and technological advancements in business.
Powered by  - Get 15% off with code: PIKWIZARD15


downloads
Tags:
More
Credit Photo
If you would like to credit the Photo, here are some ways you can do so
Text Link
photo Link
<span class="text-link">
<span>
<a target="_blank" href=https://pikwizard.com/photo/data-analyst-examining-digital-bar-chart-with-3d-elements/9ae390e9826d797093da7e076f7edfeb/>PikWizard</a>
</span>
</span>
<span class="image-link">
<span
style="margin: 0 0 20px 0; display: inline-block; vertical-align: middle; width: 100%;"
>
<a
target="_blank"
href="https://pikwizard.com/photo/data-analyst-examining-digital-bar-chart-with-3d-elements/9ae390e9826d797093da7e076f7edfeb/"
style="text-decoration: none; font-size: 10px; margin: 0;"
>
<img src="https://pikwizard.com/pw/medium/9ae390e9826d797093da7e076f7edfeb.jpg" style="margin: 0; width: 100%;" alt="" />
<p style="font-size: 12px; margin: 0;">PikWizard</p>
</a>
</span>
</span>
Free (free of charge)
Free for personal and commercial use.
Author: Authentic Images
Similar Free Stock Images

Premium


Premium

Premium


Premium


Premium


Premium

Premium


Premium


Premium


Premium


Premium


Premium


Premium

Premium


Premium

Premium


Premium


Premium


Premium


Premium


Premium

Premium


Premium


Premium


Premium

Explore More Free Stock Images