
- Home >
- Stock Photos >
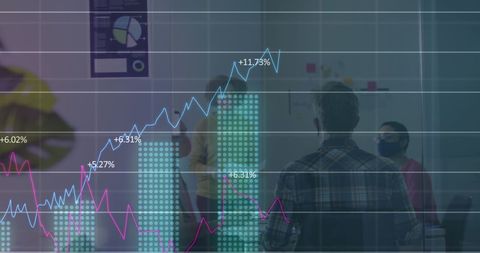
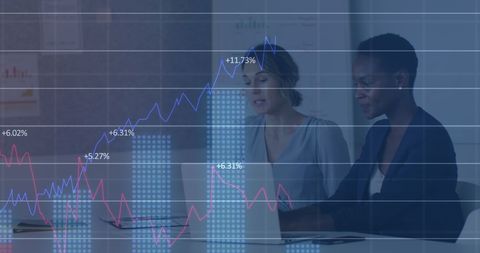
- Data Analyst Explaining Trends with Statistical Graph Overlays
Data Analyst Explaining Trends with Statistical Graph Overlays Image

Dynamic portrayal of data analysis in action, showing an African American man discussing statistical graphs appearing prominently. Ideal for themes of digital technology, business analytics, financial forecasting, and consulting projects, emphasizing modern and innovative approaches to data-driven strategies.
Powered by 


downloads
Tags:
More
Credit Photo
If you would like to credit the Photo, here are some ways you can do so
Text Link
photo Link
<span class="text-link">
<span>
<a target="_blank" href=https://pikwizard.com/photo/data-analyst-explaining-trends-with-statistical-graph-overlays/3201a43977300a5af3aa59fadd000983/>PikWizard</a>
</span>
</span>
<span class="image-link">
<span
style="margin: 0 0 20px 0; display: inline-block; vertical-align: middle; width: 100%;"
>
<a
target="_blank"
href="https://pikwizard.com/photo/data-analyst-explaining-trends-with-statistical-graph-overlays/3201a43977300a5af3aa59fadd000983/"
style="text-decoration: none; font-size: 10px; margin: 0;"
>
<img src="https://pikwizard.com/pw/medium/3201a43977300a5af3aa59fadd000983.jpg" style="margin: 0; width: 100%;" alt="" />
<p style="font-size: 12px; margin: 0;">PikWizard</p>
</a>
</span>
</span>
Free (free of charge)
Free for personal and commercial use.
Author: Awesome Content
Similar Free Stock Images

Premium


Premium


Premium


Premium


Premium


Premium


Premium


Premium


Premium


Premium


Premium

Premium
Premium
Premium


Premium


Premium


Premium


Premium


Premium

Premium


Premium


Premium


Premium


Premium


Premium


Explore More Free Stock Images