
- Home >
- Stock Photos >
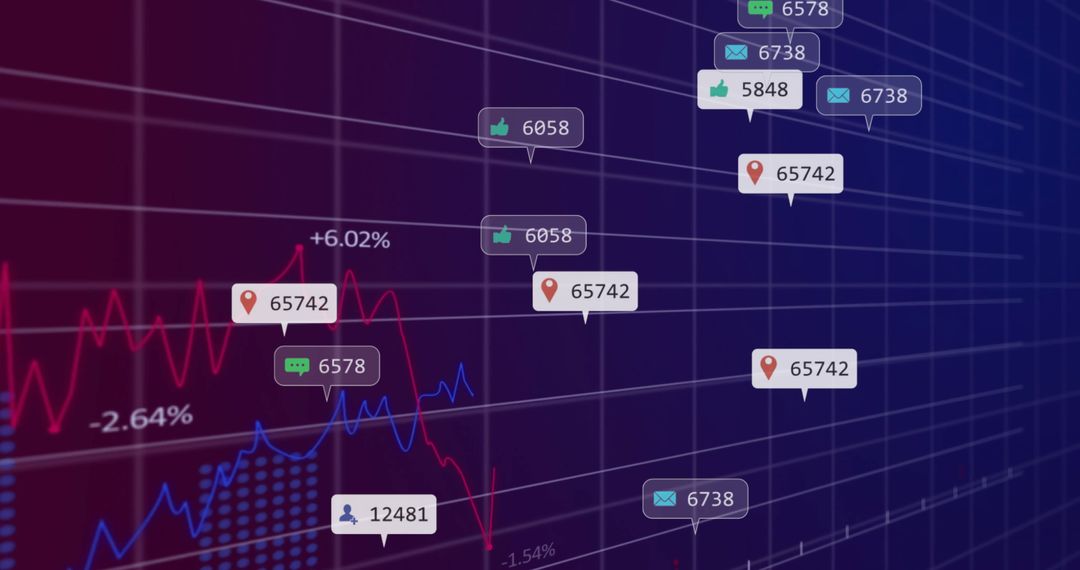
- Data Analytics and Stock Market Graphs
Data Analytics and Stock Market Graphs Image

Vivid visual of analytical data with complex charts represents stock market dynamics and financial technology. Ideal for illustrating financial reports, investment presentations, and business analyses, highlighting real-time data processing and decision-making processes in technology environments.
Powered by  - Get 15% off with code: PIKWIZARD15


2
downloads
downloads
Tags:
More
Credit Photo
If you would like to credit the Photo, here are some ways you can do so
Text Link
photo Link
<span class="text-link">
<span>
<a target="_blank" href=https://pikwizard.com/photo/data-analytics-and-stock-market-graphs/7fa13910109aa12158cf1f62c4faf825/>PikWizard</a>
</span>
</span>
<span class="image-link">
<span
style="margin: 0 0 20px 0; display: inline-block; vertical-align: middle; width: 100%;"
>
<a
target="_blank"
href="https://pikwizard.com/photo/data-analytics-and-stock-market-graphs/7fa13910109aa12158cf1f62c4faf825/"
style="text-decoration: none; font-size: 10px; margin: 0;"
>
<img src="https://pikwizard.com/pw/medium/7fa13910109aa12158cf1f62c4faf825.jpg" style="margin: 0; width: 100%;" alt="" />
<p style="font-size: 12px; margin: 0;">PikWizard</p>
</a>
</span>
</span>
Free (free of charge)
Free for personal and commercial use.
Author: People Creations
Similar Free Stock Images

Premium


Premium


Premium


Premium


Premium


Premium


Premium


Premium


Premium


Premium


Premium


Premium


Premium


Premium


Premium


Premium


Premium


Premium


Premium


Premium


Premium


Premium


Premium


Premium

