
- Home >
- Stock Photos >
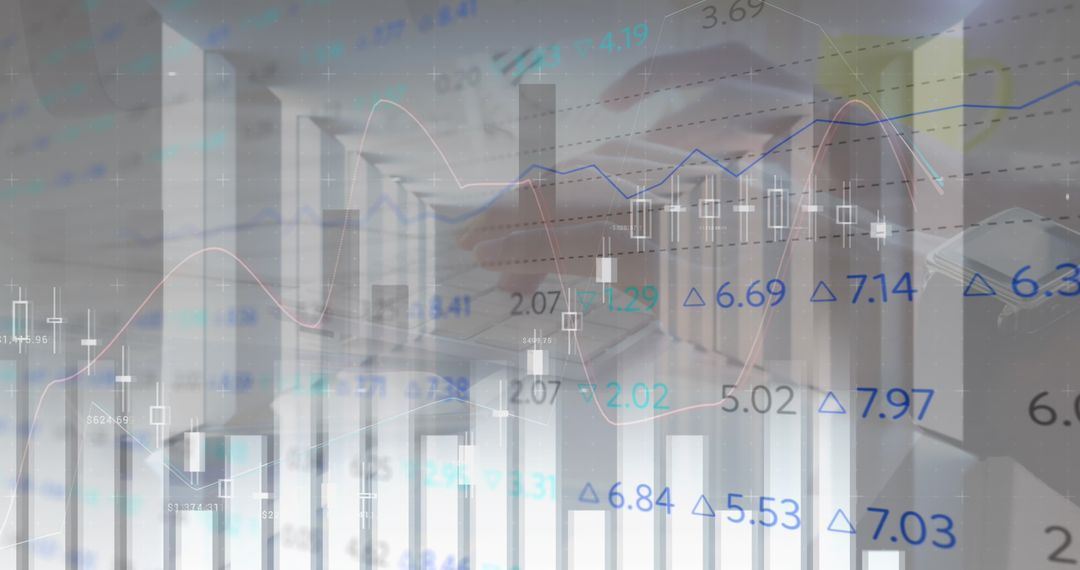
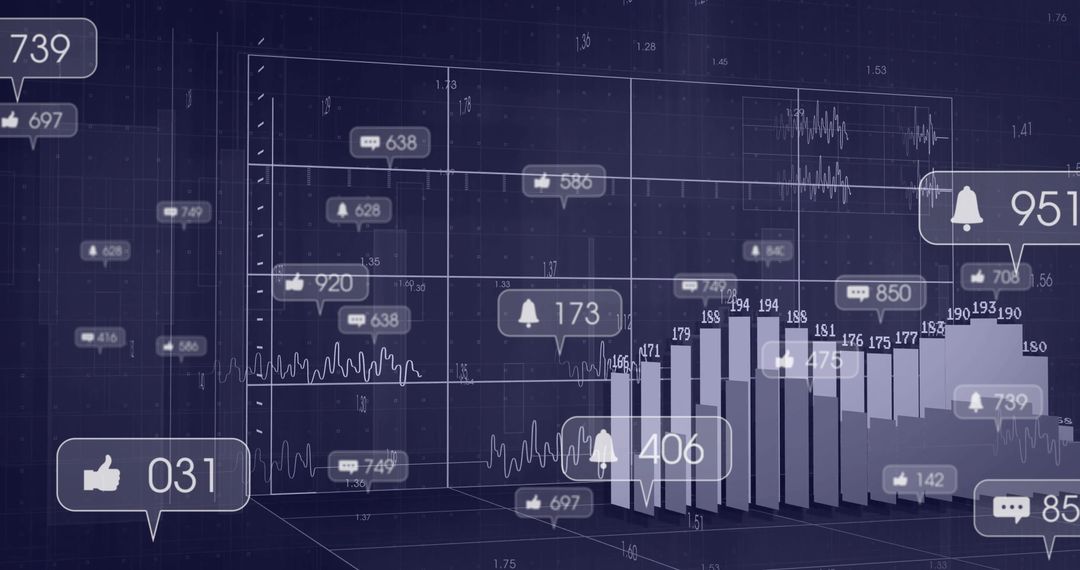
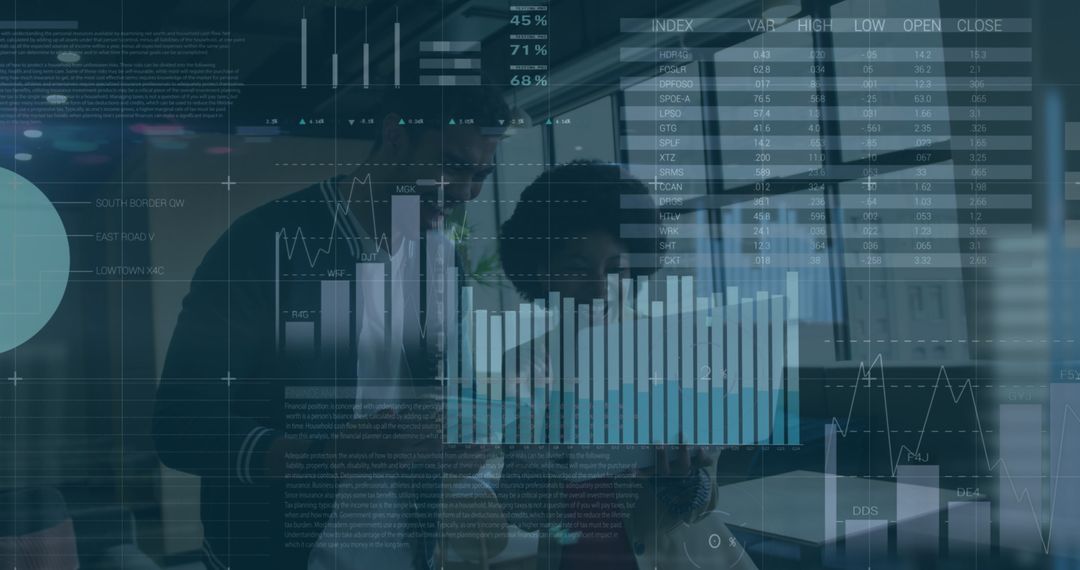
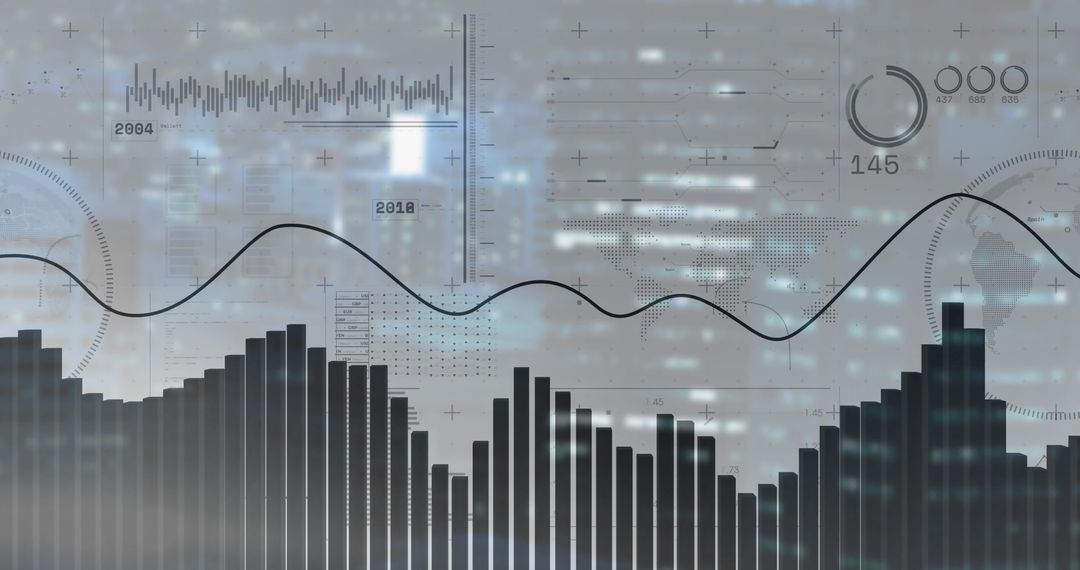
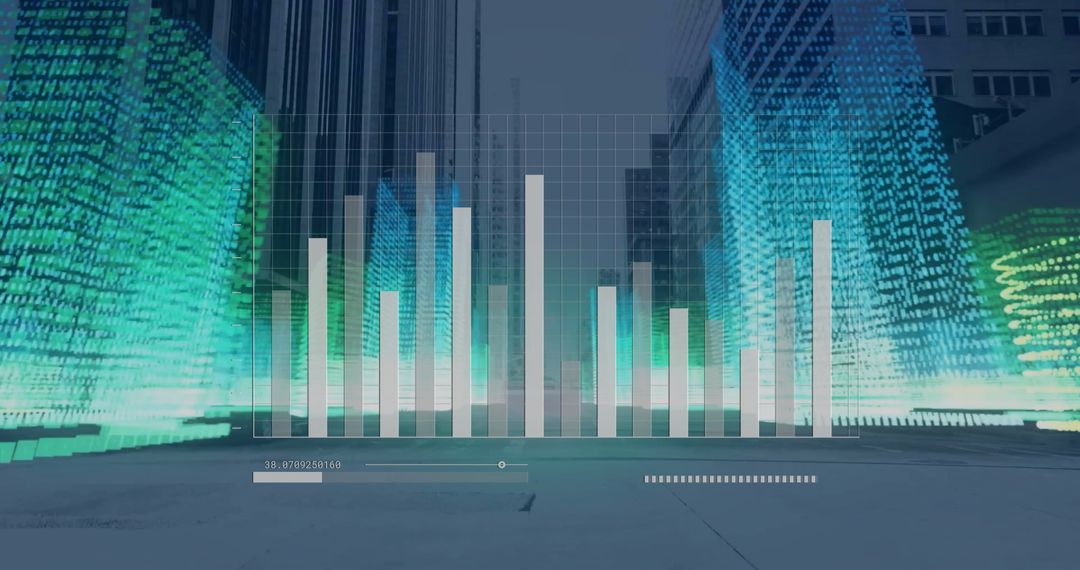
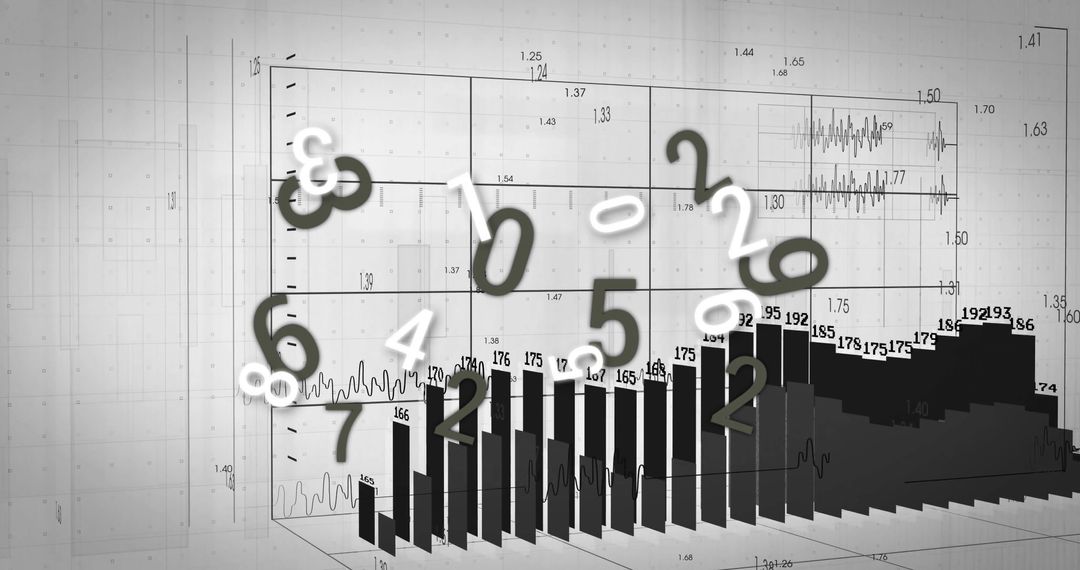
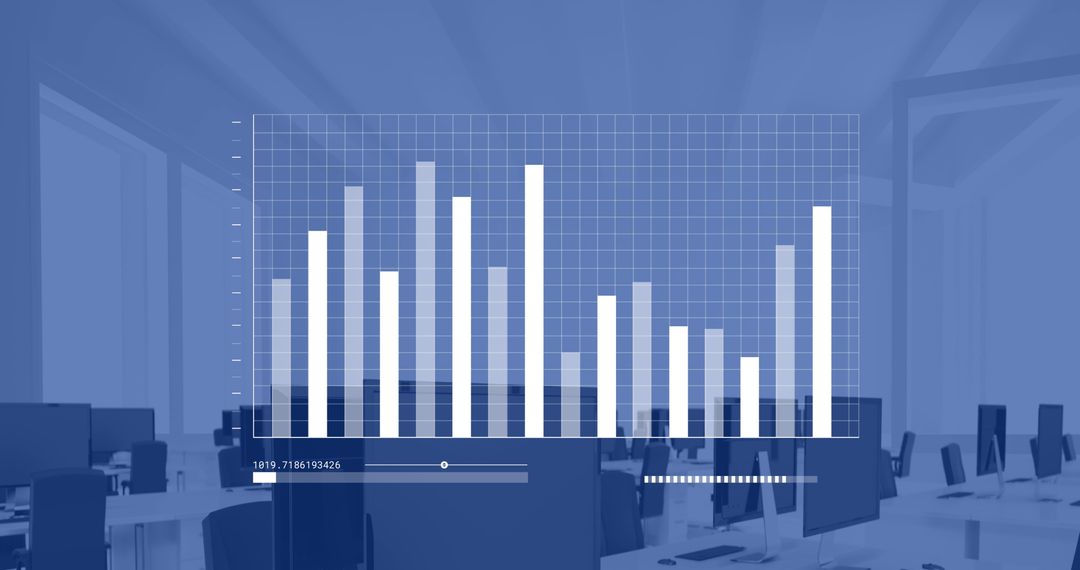
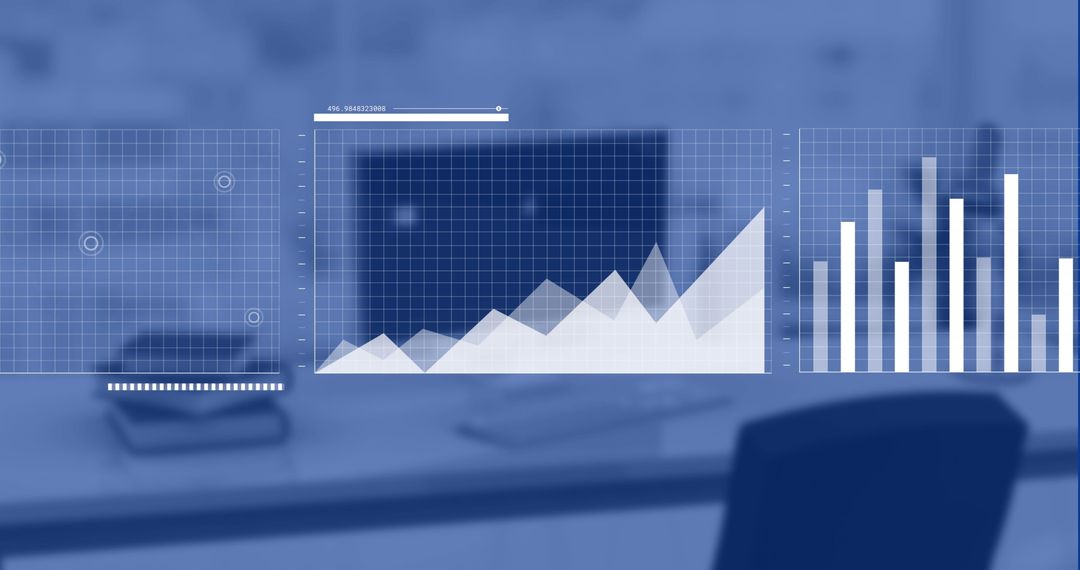
- Data Analytics and Technology Concept in Modern Office Environment
Data Analytics and Technology Concept in Modern Office Environment Image
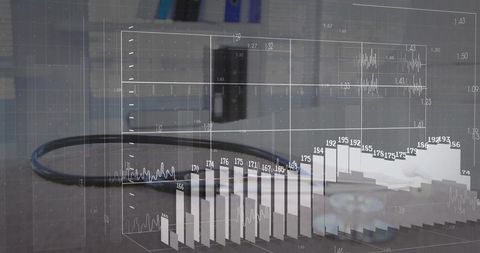
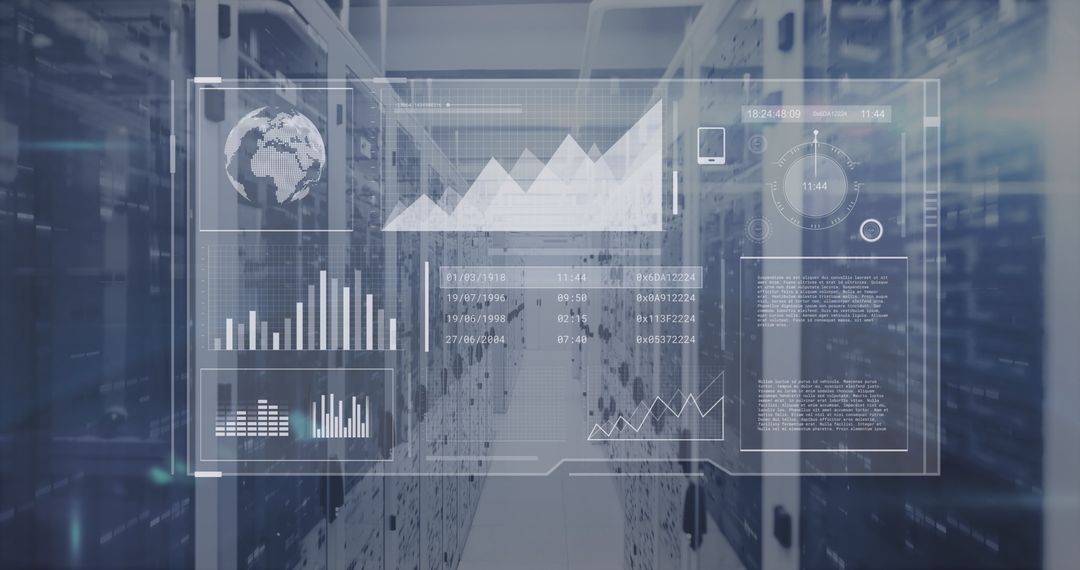
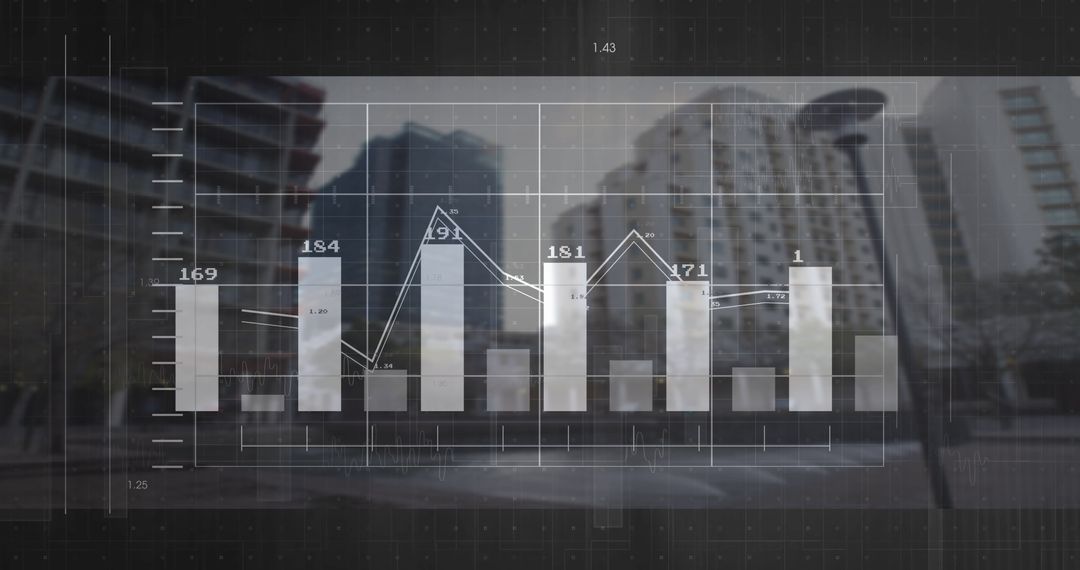
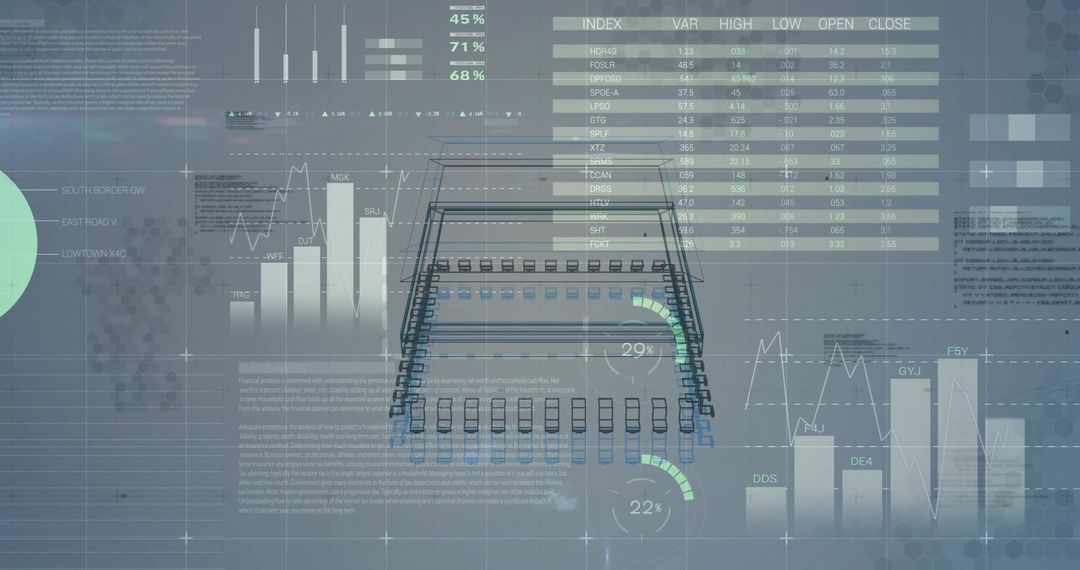
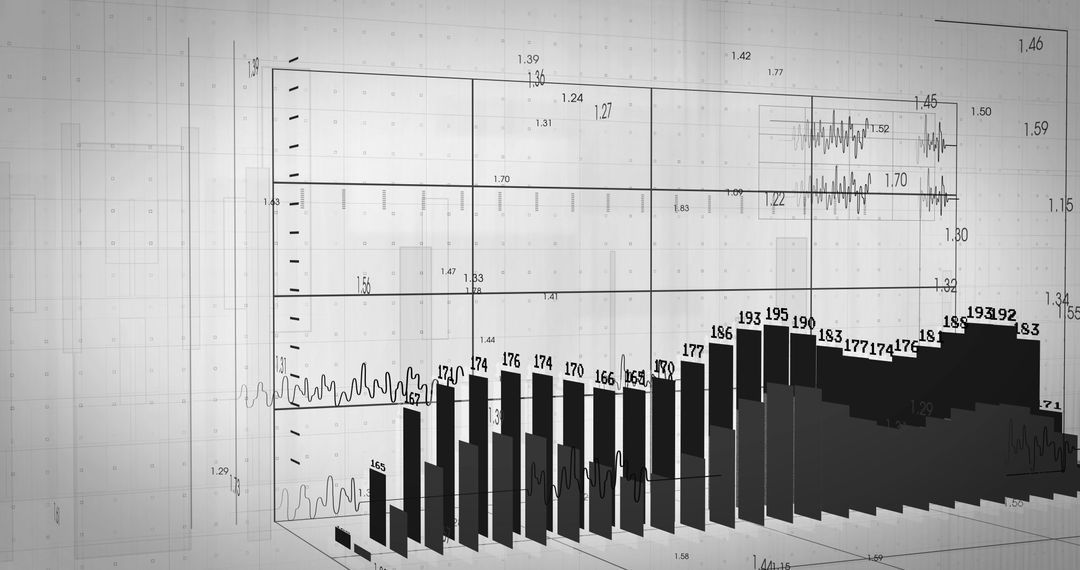
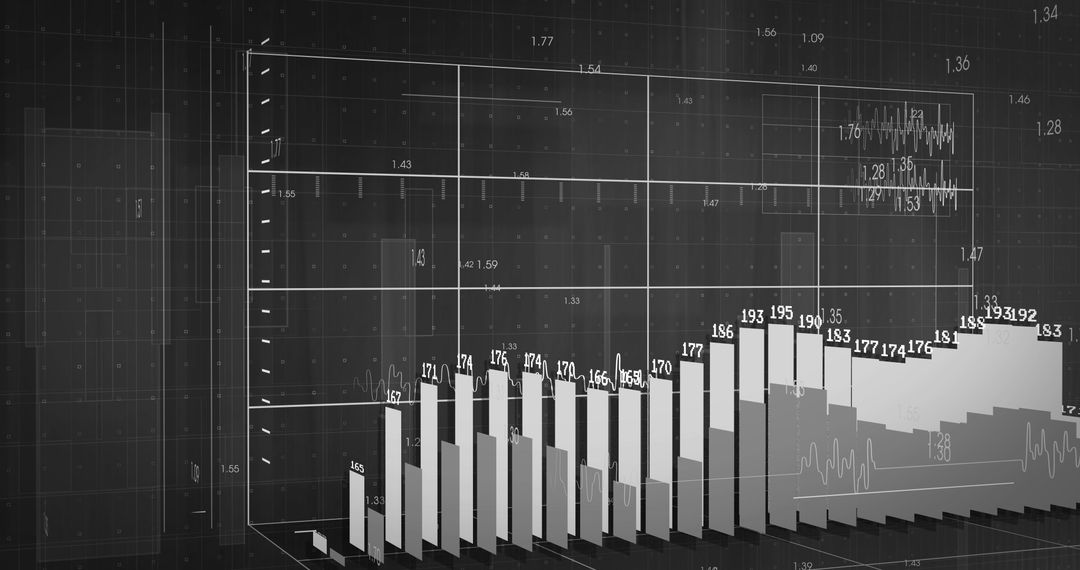
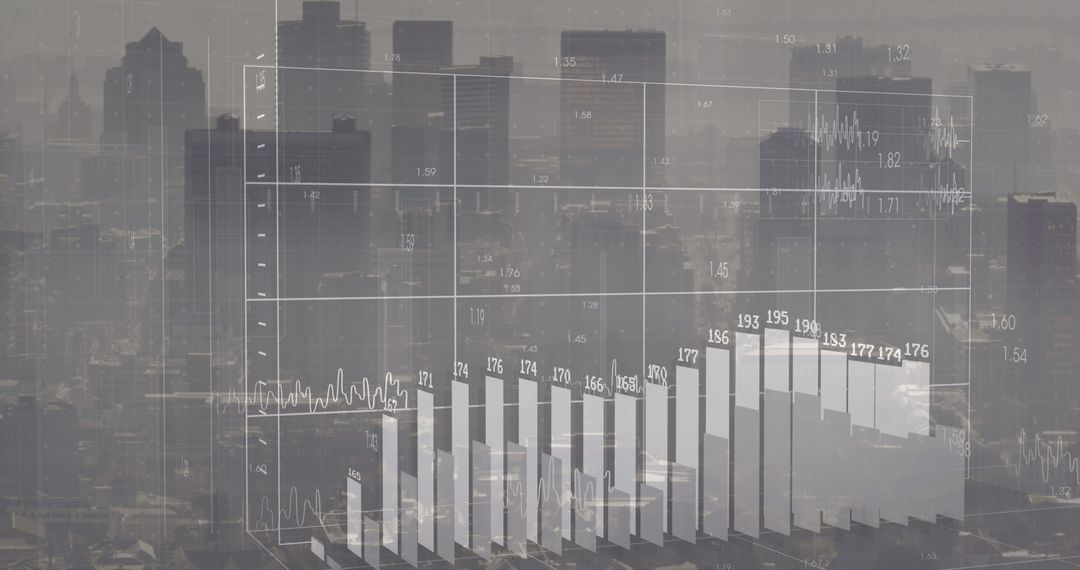
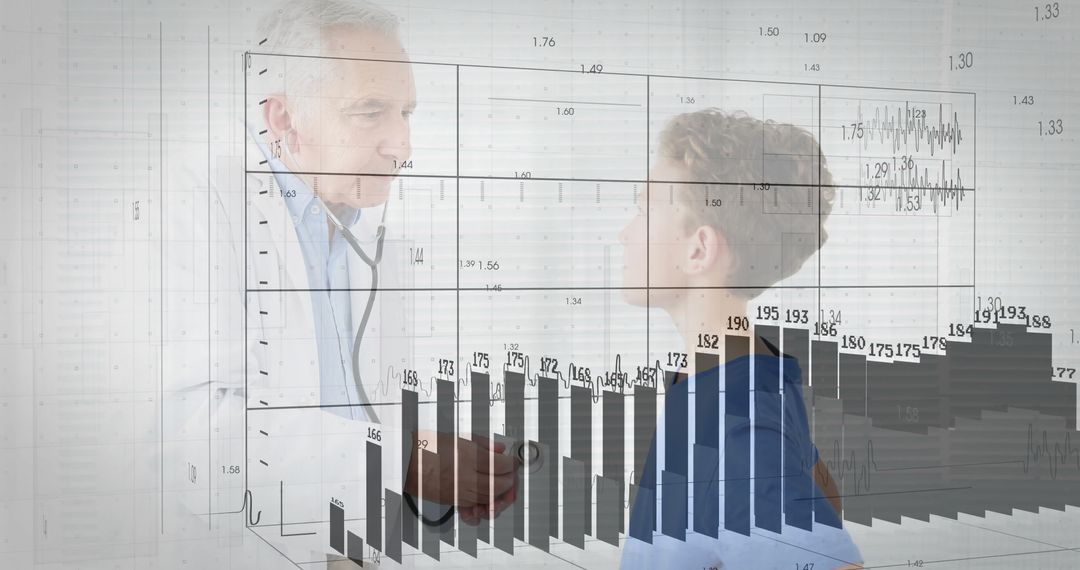
Combining imagery of a black cable and a digital overlay of graphs and analytics, this representation emphasizes the integration of technology and data in a contemporary office setting. The 3D graphs suggest digital transformation and innovation, ideal for depicting concepts related to IT workflow, data management, tech startups, and futuristic work environments. It conveys a message of progress and digital communication, suitable for presentations, websites, or promotional materials emphasizing cutting-edge technology advancements.
Powered by  - Get 15% off with code: PIKWIZARD15


0
downloads
downloads
Tags:
More
Credit Photo
If you would like to credit the Photo, here are some ways you can do so
Text Link
photo Link
<span class="text-link">
<span>
<a target="_blank" href=https://pikwizard.com/photo/data-analytics-and-technology-concept-in-modern-office-environment/1cfb90972d4295c2a606719f638f984f/>PikWizard</a>
</span>
</span>
<span class="image-link">
<span
style="margin: 0 0 20px 0; display: inline-block; vertical-align: middle; width: 100%;"
>
<a
target="_blank"
href="https://pikwizard.com/photo/data-analytics-and-technology-concept-in-modern-office-environment/1cfb90972d4295c2a606719f638f984f/"
style="text-decoration: none; font-size: 10px; margin: 0;"
>
<img src="https://pikwizard.com/pw/medium/1cfb90972d4295c2a606719f638f984f.jpg" style="margin: 0; width: 100%;" alt="" />
<p style="font-size: 12px; margin: 0;">PikWizard</p>
</a>
</span>
</span>
Free (free of charge)
Free for personal and commercial use.
Author: Authentic Images
Similar Free Stock Images

Premium


Premium


Premium


Premium


Premium


Premium


Premium


Premium


Premium


Premium


Premium


Premium


Premium


Premium


Premium


Premium


Premium


Premium


Premium


Premium


Premium


Premium


Premium

Premium

