
- Home >
- Stock Photos >
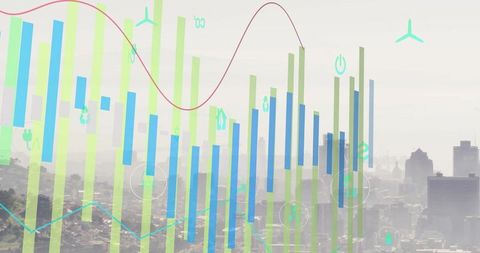
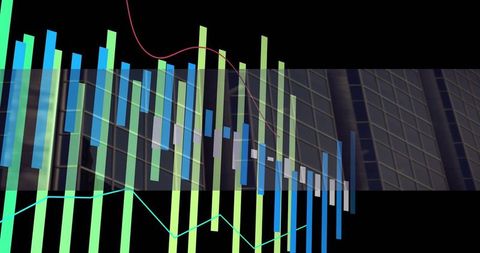
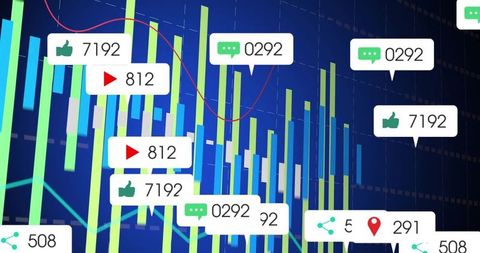
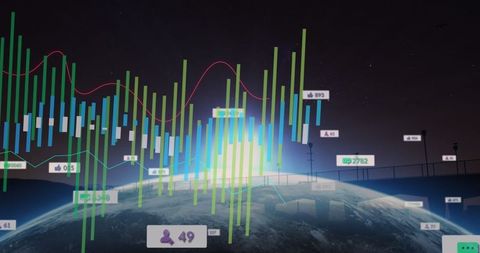
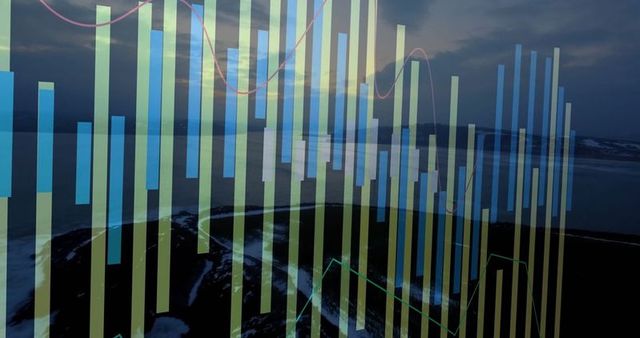
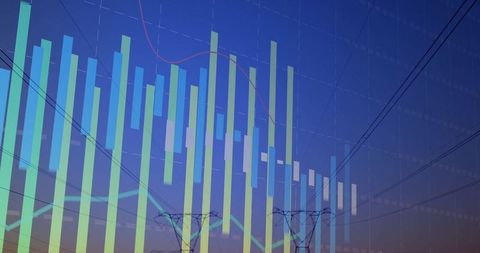
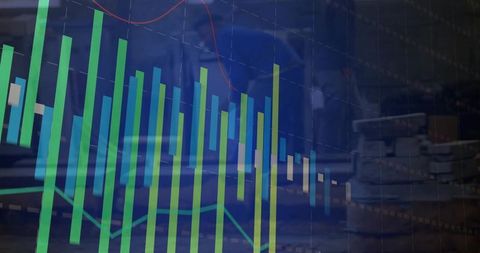
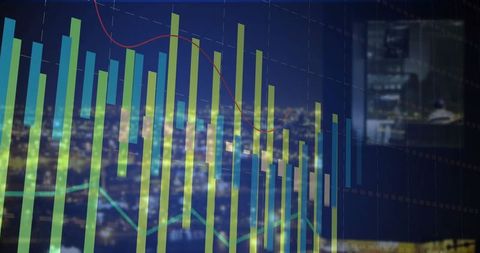
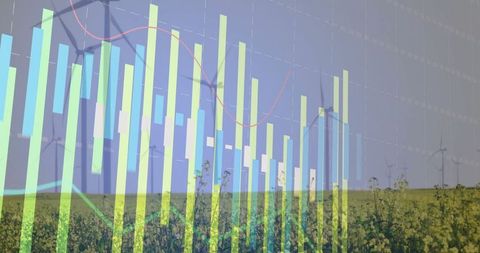
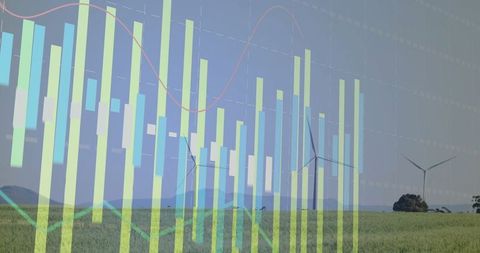
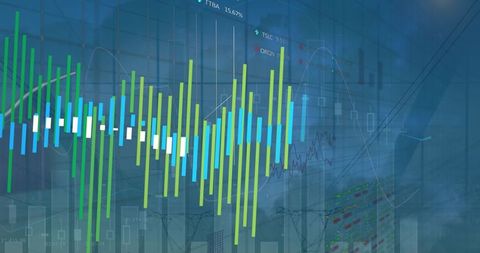
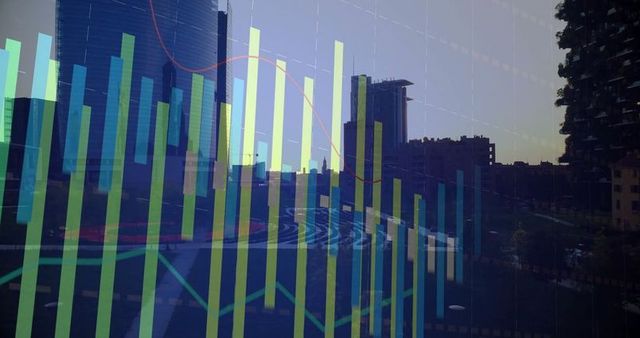
- Data Analytics and Technology Dashboard with Trend Graphs
Data Analytics and Technology Dashboard with Trend Graphs Image

Digital visualization of data analytics displayed as bar and line graphs is integrated with corporate settings. Useful for business intelligence, technology integration tools, and breakthroughs in financial analysis. Perfect for presenting data with a modern interpretation in slideshows, marketing material, and business reports dedicated to professional settings and tech-savvy audiences.
Powered by 


downloads
Tags:
More
Credit Photo
If you would like to credit the Photo, here are some ways you can do so
Text Link
photo Link
<span class="text-link">
<span>
<a target="_blank" href=https://pikwizard.com/photo/data-analytics-and-technology-dashboard-with-trend-graphs/b8a0d337c2af8106cf504e0925ffa606/>PikWizard</a>
</span>
</span>
<span class="image-link">
<span
style="margin: 0 0 20px 0; display: inline-block; vertical-align: middle; width: 100%;"
>
<a
target="_blank"
href="https://pikwizard.com/photo/data-analytics-and-technology-dashboard-with-trend-graphs/b8a0d337c2af8106cf504e0925ffa606/"
style="text-decoration: none; font-size: 10px; margin: 0;"
>
<img src="https://pikwizard.com/pw/medium/b8a0d337c2af8106cf504e0925ffa606.jpg" style="margin: 0; width: 100%;" alt="" />
<p style="font-size: 12px; margin: 0;">PikWizard</p>
</a>
</span>
</span>
Free (free of charge)
Free for personal and commercial use.
Author: Creative Art
Similar Free Stock Images

Premium

Premium

Premium


Premium


Premium


Premium


Premium


Premium


Premium

Premium


Premium


Premium


Premium


Premium

Premium

Premium


Premium


Premium


Premium


Premium


Premium


Premium


Premium


Premium


Premium


Explore More Free Stock Images