
- Home >
- Stock Photos >
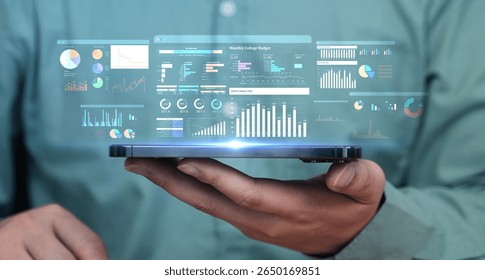
- Data Analytics and Technology on Orange Background
Data Analytics and Technology on Orange Background Image

Visualizing the intersection of business analytics and technology, with diagrams representing complex data processing against a vibrant orange background. Ideal for illustrating concepts of digital transformation, innovation drive in enterprises, or introducing technology guides in corporate presentations.
Powered by  - Get 15% off with code: PIKWIZARD15


downloads
Tags:
More
Credit Photo
If you would like to credit the Photo, here are some ways you can do so
Text Link
photo Link
<span class="text-link">
<span>
<a target="_blank" href=https://pikwizard.com/photo/data-analytics-and-technology-on-orange-background/2a0c4fd973b0e3fbe355182e53d4ad02/>PikWizard</a>
</span>
</span>
<span class="image-link">
<span
style="margin: 0 0 20px 0; display: inline-block; vertical-align: middle; width: 100%;"
>
<a
target="_blank"
href="https://pikwizard.com/photo/data-analytics-and-technology-on-orange-background/2a0c4fd973b0e3fbe355182e53d4ad02/"
style="text-decoration: none; font-size: 10px; margin: 0;"
>
<img src="https://pikwizard.com/pw/medium/2a0c4fd973b0e3fbe355182e53d4ad02.jpg" style="margin: 0; width: 100%;" alt="" />
<p style="font-size: 12px; margin: 0;">PikWizard</p>
</a>
</span>
</span>
Free (free of charge)
Free for personal and commercial use.
Author: Creative Art
Similar Free Stock Images

Premium


Premium

Premium


Premium


Premium

Premium


Premium


Premium

Premium

Premium


Premium

Premium


Premium


Premium


Premium


Premium


Premium

Premium


Premium


Premium


Premium


Premium


Premium


Premium

Premium


Explore More Free Stock Images